Adaptive Behaviour Assessment System: Indigenous Australian Adaptation Model (ABAS: IAAM)

Abstract
The study objectives were to develop, trial and evaluate a cross-cultural adaptation of the Adaptive Behavior Assessment System-Second Edition Teacher Form (ABAS-II TF) ages 5-21 for use with Indigenous Australian students ages 5-14. This study introduced a multiphase mixed-method design with semi-structured and informal interviews, school observations, and psychometric analyses of existing and new Northern Territory student data. It trained teachers to undertake psychological testing of Indigenous students. The cross-cultural adaptation was performed according to the internationally recommended methodology, using forward translation, back-translation, revision by an expert committee, and a pilot trial. The reliability was estimated through internal consistency and standard error of measurement. The validity was assessed through test content, response process, internal structure, internal consistency, age group differences, inter-correlations among adaptive domains, and correlations with other variables. A clinical validity study tested students‟ performance with and without special education needs. The results indicated good internal consistency for the adaptive domains and composite score (Social Adaptive Domain, alpha=.92; Conceptual Adaptive Domain, alpha=.94; Personal Adaptive Domain, alpha=.78; General Adaptive Composite, alpha=.94). The standard error of measurement indicated high test accuracy. Content -, construct -, and concurrent validity were measured. Concurrent validity evaluated the mean scores of students with and without special education needs, indicated significant variance (p<0.001). The data showed that the cross-cultural adaptation process was successful, and the adapted instrument demonstrated satisfactory psychometric properties, making it valid and reliable to use in the Indigenous context.
Keywords: Psychological testing, adaptive behaviour, cross-cultural adaptation, mixed-methods, Indigenous Australian students
Introduction
School psychologists at Northern Territory (NT) Department of Education provide psycho- educational information to schools and parents. They obtain evidence through assessment and testing. Typical assessments may include testing of intellectual -, academic -, adaptive behaviour - and/or social and emotional functioning (Australian Psychological Society (APS), 2013).
NT school psychologists further ascertain levels of special education needs and verify formal diagnoses in advising the current Special Education Support Program (SESP) funding process (SESP, 2015). Responsible test use which includes the administering of culturally appropriate psychological tests is therefore essential for valid and reliable test outcomes (Bartram, 2001; Bartram, Byrne, Leong, Hambleton, Oakland, van de Vijver & Cheung, 2009). School psychologists are required to use standardised test results to verify formal diagnosis or specific disabilities (APS, 2012; APS, 2013).
While there are an increasing number of standardised psychological tests available for mainstream use (Pearson Clinical Assessment Australia & New Zealand, 2015) there are very few instruments tailored for use with Australian Indigenous school students. Concerns about the widespread use of mainstream tests with Indigenous people have been reported in the international literature over recent decades (Dingwall, Pinkerton, & Lindeman, 2013; Kearins, 1981;1986; Lonner & Sandberg, 1985; Westerman, 2007). Calls for cross-cultural test adaptation have also been a feature of this literature (Hambleton, Merenda, & Spielberger, 2005). Despite these concerns, Australian school psychologists continue to rely on mainstream tools to assess Indigenous students. This carries risk of unreliable test results and invalid interpretation, misdiagnosis or over-diagnosing (APS, 2012; Ferrari, 2009; Westerman, 2007).
The use of mainstream psychological assessment tools with Indigenous students raises several concerns. These include the quality of assessments, issues of equity, the cultural relevance of test materials, and how they take account of Indigenous language use and the socio-economic background of students. The cultural knowledge of the practitioner can also be a significant factor in test administration and interpretation (Dana, 1994; Kearins, 1988; Klenowski, 2009). These continuing concerns highlight the need for developing appropriate and culturally safe psychological tools for Indigenous students (Dingwall et al., 2013).
NT school psychologists have identified the need for a cultural specific measure of students‟ adaptive behaviour for a) determining the level of adaptive behaviour functioning (Harrison & Oakland, 2003), b) identifying adaptive strengths and weaknesses (Harrison & Oakland, 2003), c) informing diagnosis and the level of severity of functional impairments, e.g. intellectual disability (American Psychiatric Association, 2013), c) informing education programs, and d) informing the school funding for children with special needs (School Psychology Practice Handbook, 2015).
The Adaptive Behavior Assessment System-Second Edition Teacher Form (ABAS-II TF) was developed in the United States with psychometric properties considerable suitable for use in Australia. It is a teacher rating form which assesses 10 skill areas/adaptive domains, produces a general adaptive composite score (GAC), and has high internal consistency and test re-test reliability (Harrison & Oakland, 2003; Pearson Clinical Assessment Australia & New Zealand, 2015). Key areas of functioning assessed by the ABAS-II TF include Conceptual Reasoning, Social Interactions, and Practical Functioning. These adaptive domains comprise items assessing specific skills in communication, community use, functional academics, school living, health and safety, leisure, self-care, self-direction, social and work areas.
This study’s objective was to develop, evaluate and trial a cross-cultural adaptation of the ABAS-II TF for Indigenous students ages 5-14. It involved 9 of the 10 skill areas, excluding the 10th skill area, “work” (Harrison & Oakland, 2003).
Methods
Ethics clearance was obtained from the Human Research Ethics Committee of the Northern Territory Department of Health and Menzies School of Health Research, and Charles Darwin University Human Research Ethics Committee. The NT Department of Education gave approval for the study and permission was granted by the Western Psychological Services Los Angeles for the cultural adaptation study. Informed consent was obtained for all participants and stakeholders.
This study used a multiphase, mixed-methods design which was a natural extension of the procedures school psychologists use in their day-to-day activities (Kalil, Yoshikawa, Way, & Weisner, 2008; Powell, Mihalas, Onwuegbuzie, Suldo, & Daley, 2008). This study sample involved NT Indigenous and non-Indigenous students, educators and schools from both government and independent schools, and was broadly representative of the schooling circumstances of the Northern Territory.
Semi-structured interviews were first conducted with sixteen educators and in-school observations made to obtain “local expert” information on the cultural, community and school relevance of each original checklist item.
Convenience sampling was used to select a sample of 150 students and attending NT schools who had been assesed with the ABAS-II. This sample was stratified to obtain a balanced distribution of Indigenous and non-Indigenous students, males and females, and younger (age 5-9 years) and older students (10-14 years). The ABAS-II TF data collected on this sample was then examined to identify items and scales which might be operating differently for Indigenous and non- Indigenous students. Univariate and bi-variate descriptive analyses, reliability analyses, principal component analysis, and exploratory factor analysis was carried out using the Statistical Package for the Social Sciences (SPSS) software version 20. Rasch modelling analysis was then undertaken using the Rasch Unidimensional Measurement Model (RUMM2020) software (Kreiner & Christensen, 2011; Smith, 2002). Inferences from these analyses and the findings from the structured interviews were combined to inform the selection of items to be retained in the initial version of the adapted measure.
The next stage of the adaptation process involved wording and language modifications of the standard ABAS-II TF items to standard Australian English relevant to the Indigenous school context. This process followed the internationally recommended guidelines for translation, back- translation, revision by a committee, and trial administration of the adapted instrument (Beaton, Bombardier, Guilemin, & Ferraz, 2000; Guillemin, Bombardier, & Beaton, 1993). Three independent translators completed the forward translation and all three agreed on a consensus version. This was then back-translated into United States (U.S) English and cross-verified with the original version. A committee comprising of a Speech Therapist, a Speech and Language teacher, and a School Psychologist assessed this version for content validity. The initial revised version was titled the Adaptive Behaviour Assessment System: Indigenous Australian Adaptation Model (ABAS: IAAM).
The ABAS: IAAM was then piloted in the next phase of the adaptation process. This involved training 47 school teachers to administer the ABAS: IAAM. These teachers were also interviewed on their perceptions of the cultural and contextual relevance of the adapted tool. The pilot data were collected on the sample of 120 Indigenous students who were broadly representative of the NT Indigenous school population. They included 62 (51.7%) boys, and 58 (48.3%) girls. Students from the urban education settings were in the minority (15%) in comparison to the remote setting (42.5%) and the very remote setting (42.5%), and 26.6% of participating students were identified as having special education needs.
Analytic methods
A range of descriptive statistical analyses, reliability analyses, principal component and factor analyses were then undertaken to further refine the adapted tool and to document the measurement properties of the final version. This included identifying items not working as they should in their contribution to specific domain scales and the General Adaptive Composite (GAC) score (Beaton, et al., 2000). Comparative assesments of these students were also made by two school psychologists using the Naglieri Nonverbal Assessment Test and the Wechsler Nonverbal Scale of Ability, both of which are considering culturally fair for use with Indigenous students (Naglieri, 2003; Wechsler & Naglieri, 2006).
The reliability of the ABAS: IAAM was estimated through its internal consistency (alpha) and standard error of measurement (SEm). Validity was assessed through effective test content, response process, internal structure, internal consistency and examination of age group differences. Validity was further assessed through examination of the inter-correlations among adaptive domains and correlations with other measures. Discriminant validity was assessed using Independent–Samples T-Tests of mean differences in the ABAS: IAAM scores of students with and without special education needs when assessed on other cognitive measures (Field, 2009; Howell, 2007).
Findings
The initial psychometric analysis of the 150 ABAS-II Teacher Forms showed strong psychometric properties across the Indigenous and non-Indigenous Australian students (Cronbach‟s alpha of .735 and .981 respectively). However, several item performance differences were noticed between the groups i.e. differential item functioning (cultural bias). These and other items identified by the qualitative analysis as ambiguous or inappropriate for the Indigenous context were then eliminated to reduce the original 172 items to 47 items considered in the first factor analysis. This resulted in an even distribution of retained items across the original 9 ABAS-II scales: Communication n=6 (C2, C3, C4, C8, C16, C18); Community Use n=5 (CU1, CU6, CU8, CU13, CU14); Functional Academics n=5 (FA3, FA4, FA8, FA13, FA18); Health and Safety n=5; (HS1, HS3, HS8, HS12, HS18); Leisure n=5 (L1, L8, L12, L13, L16); School Living n=5, (SL2, SL8, SL10, SL16, SL17); Self-Care n=6, (SC1, SC5, SC8, SC10, SC12, SC17); Self-Direction n=5, (SD3, SD4, SD14, SD16, SD19); Social n=6 (S2, S8, S9, S14, S15).
Principal Component Analysis
The Kaiser-Meyer-Olkin (KMO) measure of the adequacy of the sample of 150 ABAS- II Teacher Forms was .93, indicating it was adequate for factor analysis (Field, 2005). The Bartlett‟s test of sphericity measured was significant (p < .001) (Field, 2005) showing the variance in each variable accounted for by all components or factors (Field, 2009). The variables, L13 (.58) and L16 (.59) did not fit well with this factor solution, but were included in the analysis. The initial eigenvalue indicated eight components over 1 with a cumulative percentage of 72.1. The Pattern Matrix with an oblique (promax) rotation method suggested acceptable loadings for 42 of the 47 items suggesting that items CU8, SC5, SL10, and SD16 should be dropped.
Exploratory Factor Analysis
The next step was to conduct an Exploratory Factor Analysis with the remaining 42 items. The KMO measure of sampling adequacy of 0.93 indicated this was acceptable for factor analysis (Field, 2009); and the Bartlett‟s test of sphericity was also significant (p < .001) (Field, 2009). The resulting communality values indicated the variables, C2 (.56), C3 (.59), CU13 (.49), L13 (.58), L1 (.59), L16 (.51), SL2 (.54), and SL17 (.54) did not fit well with the factor solution, but were retained in the analysis. The scree plot of Eigen values indicated 3 to 5 factors contributing to the main variability of the data (Field, 2009). Three factors were extracted using the Principal Axis Factoring with an oblique „promax‟ rotation method. The rotation converged in 6 iterations. Acceptable loadings, factors >.4 and no cross-loadings, for 31 of the 42 items were detected. Items C8, C16, FA3, FA4, HS3, L16, SL8, SD4, S8, and S14 were deleted. The reduced items had factor loadings between .466 (SC1) and .921 (HS16).
The reliability of the three adaptive domains and general adaptive composite score of the pilot ABAS: IAAM indicated excellent internal consistency (Cronbach‟s alpha, CA) for the Indigenous sample (75), Non-Indigenous sample, and the combined sample (150). For the combined sample the CA for factor domain 1, 2 and 3, and GAC, was .93, .94, .88, and .95 respectively.
Rasch Modelling
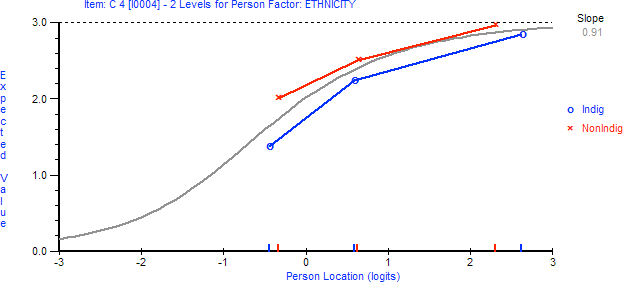
The reliability indexes of the factor domains and general adaptive composite were obtained with* and without** item extremes. Cronbach‟s alpha for GAC = .95*, .94**; FD 1 = .93*, .92**; FD 2 = .94*, .92**. The Rasch analysis further ascertained item and scale person/response characteristics of the pilot ABAS: IAAM with Indigenous and non-Indigenous student data, and identified certain items having different response characteristics (i.e. bias), as per next item example: “Tells teachers, friends, or others about his/her favorite activities”. This item indicates mild bias towards non-Indigenous students.
Cross-cultural adaptation
There was a good agreement on the forward U.S English to standard Australian English for the NT Indigenous context, and the backward translation to U.S English that was compared with the original version and reviewed by the expert committee of linguistic and education professionals and required only minimal changes. The respondents replied positively on adaptations made to the directions and checklist items of the adapted version during their training. They were pleased with the much shorter checklist version. One item was referred back to the expert committee. Table 1 presents selected changes made to the “Directions” and “checklist items”.
Pilot trial of the adapted measure
In order to evaluate the equivalence of the ABAS: IAAM within the Indigenous cultural environment, trained respondents completed ABAS: IAAM forms for the 120 participating students as a trial (Beaton et al., 2000). These data were then investigated with an Exploratory Factor Analysis (EFA). The resulting KMO of .90 confirmed sampling adequacy for factor analysis (Field, 2009) and the Bartlett‟s test of sphericity was also significant (p <.001) (Field, 2009). The EFA with the 31 retained items produced 6 initial factors with eigenvalues larger than 1, together accounting for 73.23% of the total variance. The first factor accounted for 46.2% of the variance, the second for 8.2%, the third for 6.6%, the fourth for 4.8%, the fifth for 3.8%, and the sixth for 3.7%. After rotation of the 6 factors with eigenvalues greater than 1, factors 1, 2, 3 had six, seven, and six items (respectively) with factor loadings greater than 0.4. Factors 4, 5, 6 had five, four, and two items (respectively) with factor loadings greater than 0.4. However, the spread of the items in the factors in this solution were not readily interpretable. The scree plot was then assessed visually to determine which components (factors) explained most of the variability in the data (Field, 2009). As the scree plot straightened after factors 3 to 6, and only explained a negligible proportion of the variability, these were considered unimportant (Field, 2009).
In a three-factor solution which converged in six iterations, five items were found to load on the third factor, eleven items on the second and eight items on the first factor. The three factors accounting for 61% of the total variance. Items Q10 - C4; Q17 – HS12; Q18 – L12; Q20 – CU13; Q22 – SD14; Q24 – S15; and Q28 – SL17 were deleted due to their cross-loading onto more than one factor domain. Factor 1 included a combination of conceptual and practical items. Factor 2 had a combination of social, practical and conceptual items. Factor 3 contained practical items only.
There were 11 items in factor 1 with predominately social skill items and this was therefore interpreted as the Social Adaptive Domain. The second factor had 8 predominately conceptual items and was interpreted as the Conceptual Domain, and the third factor domain included only self-care items and interpreted as the Personal Adaptive Domain.
Psychometric properties of the ABAS-IAAM
Reliability
The ABAS: IAAM was administered once to each participating student due to time limit of the study, the transient nature of school attendance in remote NT Indigenous schools, and because the participating schools agreed to release only one respondent per student age-group for assessment. This meant that the pilot was only able to assess its internal consistency. Test-retest reliability, inter-rater reliability, and cross-form consistency will be assessed in planned future studies. Internal consistency (Cronbach’s coefficient) was evaluated in relation to the instrument as a whole and in relation to the factor domain. The GAC and factor domains all showed high internal consistency with alphas of 0.94, 0.92, 0.94, and 0.78 respectively. No item in any scale detracted from that scale‟s internal consistency. Internal consistency reliability of the ABAS: IAAM in regards to 5 age-groups, were evaluated. Ages 5-6, 7-8, 9-10, 11-12, and 13-14 showed high internal consistency with alphas of .92, .89, .94, .88, and .93 respectively. Students with*, and without** special education needs reached high internal consistency with alphas; ages 5-6 (-.14*; .87**); ages 7-8 (.86*, .87**); ages 9-10 (.92*, .90**); ages 11-12 (.90*, .81**); and ages 13-14 (.91*, .88**) (see table 2).
Standard of measurement (SEm)
This study used SEm to demonstrate high test accuracy and test reliability (Harrison & Oakland, 2003). It provided an indication of the scattering of the measurement errors when trying to estimate students‟ true scores from their observed test scores (Furr & Bacharach, 2008). The Confidence intervals constructed a range of values within which the true value of the population mean will fall 95% of the time (Field, 2009).
The SEm scores of the factor domains and the GAC were low which specified accurate test scores (Harrison & Oakland, 2003). The SEm scores of the factor domains and the GAC for all age- groups, 5-6, 7-8, 9-10, 11-12, and 13-14, were low which indicated accurate test scores. For the age-groups 11-12, and 13-14, the third domain, Personal Adaptive Domain, did not show any variance in test scores and could not calculate the SEm or Confidence Interval scores. This domain needs more difficult items for the older age-groups. For the clinical sample, the SEm scores for students with - and without special education needs were low and indicated accurate test scores.
Validity
The content validity of the ABAS: IAAM was evaluated by the translators and the review committee throughout the cross-cultural adaptation process and through qualitative analyses of the comments expressed by the interviewees and the respondents. Observation analyses contributed to the quality of the content. Although reductions of items were made; there are items of all skill areas remaining in the new tool. Cross-adaptations of certain items were made (see Table 1). Construct validity was evaluated on whether or not the factor structure and inter-correlations of the ABAS: IAAM were similar to those of the original ABAS-II. The factor structure of both, ABAS-II and ABAS: IAAM indicate three factor domains with a general composite score. Inter-correlations among the items produced correlation ranging from .58 to .82 at p <.001 (see Table 3), and significant inter-correlations showed between the three factor domains and the General Adaptive Scale (p=.000) (see Table 3).
Concurrent validity
It is important for the ABAS: IAAM to correlate with validated measures (Furr & Bacharach, 2008). For this study, the ABAS: IAAM scores were compared with two non-verbal cognitive measurements. These measures were administered at around the same time as the ABAS: IAAM. Positive relationships were found between the ABAS Total z-scores and the WNV Full scale scores; the results follow for 5 age-groups: There were significant positive relationships between the two variables for ages 5 – 6, r (118) = .78**, p = .000; ages 7 – 8, r (118) = .43*, p = .042; ages 9 – 10, r (118) = .64**, p = .000; ages 11 – 12, r (118) = .59**, p = .001; and 13 – 14, r (118) = .54**, p = .006. **Correlation was significant at the 0.01 level (2-tailed), and * Correlation was significant at the 0.05 level (2-tailed).
There were strong correspondence between the ABAS Total z-scores and the NNAT Full scale scores; the results for 5 age-groups: There were significant positive relationships between the two variables for ages 5 – 6, r (118) = .59*, p = .012; ages 7 – 8, r (118) = .09, p = .678; ages 9 – 10, r(118) = .63**, p = .001; ages 11 – 12, r (118) = .48**, p = .001; and ages 13 – 14, r (118) = .54**, p = .002. **Correlation was significant at the 0.01 level (2-tailed), and *Correlation was significant at the 0.05 level (2-tailed).
Discriminant validity
The ability of the ABAS: IAAM to distinguish between students with and without special education needs was investigated with reference to 32 students in the sample who were independently assessed as having special education needs. Given the small size of this sub-sample only group performance differenced are reported in table 4 below.
The group of students without special education needs (N = 88) was associated with an ABAS: IAAM Total Score M = 55.28 (SD =12.23). By comparison, the group of students with special education needs (N = 32) was associated with a numerically smaller ABAS: IAAM Total Score M = 46.63 (SD = 13.26). To test the hypothesis that students with and without special education needs were associated with statistically significantly different mean ABAS: IAAM Total Scores, an independent samples t-test was performed. As indicated in Table 4, the assumption of homogeneity of variances was tested and satisfied via Levene‟s F test, F(118) = .81, p = .370. The independent samples t-test was associated with a statistically significant effect, t(118) = 3.35, p = .001. Thus, the students without special education needs had significantly larger mean ABAS: IAAM Total Scores than the students with special education needs.
Receiver’s Operating Characteristic (ROC) curves
The ROC curve is a useful way to interpret the sensitivity and specificity levels of a diagnostic test to predict some sort of a dichotomous outcome (Swets, 1973). In this study, we were interested to know if the ABAS: IAAM is a useful test in predicting the probability of students having special education needs and also, if the test was able to determine the cut-off points or scores for a referral needed for specialists intervention. The ROC curves were determined for 5 age-groups. The statistical value was less than .05 for all age-groups and seen as statistically significant. The area under the curve for all age-groups; 5-6 (1.000); 7-8 (.813); 9-10 (.944); 11-12 (.836); and 13-14 (.899), fell in the good to excellent range, ranging from .813 to 1.0, indicating that the ABAS: IAAM had good discriminant validity for this purpose. The 95% confidence interval of the area under the curve implies that for the next 100 samples of students 95% of the samples would have an area under the curve that ranges from (1.000 to 1.000) for ages 5-6; (.596 to 1.000) for ages 7-8; (.862 to 1.000) for ages 9-10; (.669 to 1.000) for ages 11-12; and (.778 to 1.000) for ages 13-14. The results displayed ranges from between .596 (poor) to 1.000 (excellent).
Conclusions
The ABAS: IAAM is the first cross-cultural adaptation of the ABAS-II Teacher Form. The original 172 items for the 9 skill areas were reduced to 24 items. The ABAS: IAAM has a similar factor structure with three factor domains and a general adaptive score. The ABAS: IAAM does not consist of skill areas, only skill items. The three factor domains are referred to as the Social Adaptive Domain, the Conceptual Adaptive Domain and the Personal Adaptive Domain. The main change from the original measure is the change of “Practical” “Adaptive Domain” to “Personal” Adaptive Domain due to the Self-Care items also being included in this domain. The other remaining practical items loaded onto either the Conceptual or Social domains. The ABAS: IAAM performed well on psychometric properties of internal consistency, standard errors of measurement/confidence intervals, content, construct and concurrent validity. In conclusion, this cross-cultural adaptation of the ABAS-II TF produced a short-form version suitable for measuring adaptive functioning of Indigenous Australian students in the Northern Territory.
Limitations
Test-retest reliability was not possible due to the study‟s scope that did not allow for longitudinal study, and the transient nature of NT Indigenous students. They further have poor attendances, specifically those attending remote and very remote education settings. Participating schools released only one respondent per student age-group (inter-rater reliability was not possible). This study involved the only the ABAS-II Teacher Form (cross-form consistency was not possible). Generalizations of the study’s findings should be made with caution. Small and convenience samples were introduced throughout the study. Although we made efforts to have our samples representative with respect to age, gender, education region and setting, the student sample, including those with and without special education needs were not entirely random. The lack of information on the extent of each child‟s specific education need is another limitation.
Suggestions for future research
Future research should consider improving the psychometric properties of the ABAS: IAAM, especially looking at adding items, for example more challenging items to the Personal Adaptive Domain for the older students to create more variance and less challenging items to the Conceptual Adaptive Domain for the younger students.
This study emphasized the importance of taking into consideration cultural and linguistic factors when validating measures to assess adaptive behaviour skills among Indigenous students.
Acknowledgements
The author would like to acknowledge the support received from Menzies School of Health Research, Menzies supervisors, NT Department of Education, and Student Support Manager Palmerston and Rural Region. The author would like to extend gratitude to the participants who made the study possible. The author declare that there is no conflict of interest.
References
American Psychiatric Association. (2013). Diagnostic and statistical manual of mental disorders (5th ed.). Washington, DC: Author.
Australian Psychological Society. (2012). Guidelines for the provision of psychological services for and the conduct of psychological research with Aboriginal and Torres Strait Islander people. Melbourne: Australian Psychological Society Ltd.
Australian Psychological Society. (2013). The framework for the effective delivery of school psychological services in the public sector and non-government organisations: A practical guide for psychologists. The Australian Psychological Society Limited 2013. https://www.psychology.org.au/Assets/Files/2013-APS-psychological-services-framework-for- public-sector-NGO%20.pdf
Bartram, D. (2001). The development of International Guidelines on Test Use. The International Test Commission Project International Journal of Testing, I(2), 93-114.
Bartram, D., Byrne, B. M., Oakland, T., Leong, F. T. L., van de Vijver, F. J. R., Hambleton, R. K., & Cheung, F. M. (2009). A critical analysis of cross-cultural research and testing practices: Implications for improved education and training in psychology. Training and Education in Professional Psychology, 3(2), 94-105.
Beaton, D. E., Bombardier, C., Guillemin, F., & Ferraz, M. B. (2000). Guidelines for the process of cross- cultural adaptation of self-report measures. Spine 2000, 25, 3186-3191. https://doi.org/10.1097/00007632- 200012150-00014
Byrne, B. M., Oakland, T., Leong, F. T. L., van de Vijver, F. J. R., Hambleton, R. K., Cheung, F. M., & Dana, R. H. (1994). Testing and assessment ethics for all persons: Beginning an agenda. Professional Psychology: Research and Practice, 25(4), 349-354. https://doi.org/10.1037/0735- 7028.25.4.349
Dingwall, K., Pinkerton, J., & Lindeman, M. A. (2013). “People like numbers”: a descriptive study of cognitive assessment methods in clinical practice for Aboriginal Australians in the Northern Territory. BMC Psychiatry, 13-42.
Ferrari, J. (2009). Aboriginal students wrongly diagnosed as disabled. The Australian August 17. http://www.adelaidenow.com.au/news/aboriginal-students-wrongly-diagnosed-as-disabled/story- e6frea6u-1225762715742
Field, A. (2009). Discovering statistics using SPSS. (3rd ed.). SAGE Publications Inc. 2455 Teller Road Thousand Oaks, California 91320.
Fur, R. M., & Bacharach, V. R. (2008). Psychometrics. Sage Publications, Inc.
Guillemin, F., Bombardier, C., & Beaton, D. (1993). Cross-cultural adaptation of health related quality of life measures: literature review and proposed guidelines. Journal of Clinical Epidemiology, 46(12), 1417-1432.
Hambleton, R. K., Merenda P. F., & Spielberger C.D. (2005). Adapting educational and psychological tests for cross-cultural assessment. Lawrence Erlbaum Associates, Inc. Publishers 10 Industrial Avenue Mahwah, New Jersey 07430.
Harrison, P. L., & Oakland. T. (2003). Adaptive Behavior Assessment System Second Edition Manual. Harcourt Assessment, Inc.
Howell, D. C. (2007). Statistical Methods for Psychology (6th ed.). Belmont, CA: Thomson Wadsworth.
Kalil, A., Yoshikawa, H., Way, N., & Weisner, T. (2008). Mixing qualitative and quantitative research in developmental science: uses and methodological choices. Developmental Psychology 2008, 44(2), 344-354.
Kearins J. M. (1981). Visual spatial memory in Australian Aboriginal children of desert regions. Cognitive Psychology, 13, 434-460.
Kearins J. M. (1986). Visual spatial memory in Aboriginal and White Australian children. Australian Journal of Psychology, 38(3), 203-214.
Kearins, J. M. (1988). Cultural elements in testing: the test, the tester and the tested. In G. Davidson (Ed.), Ethnicity and cognitive assessment: Australian perspectives (pp. 60-70). Darwin, NT: DIT Press.
Klenowski, V. (2009). Australian Indigenous students: addressing equity issues in assessment. Teaching Education, 20(1), 77-93.
Kreiner, S., & Christensen, K. B. (2011). Exact Evaluation of Bias in Rasch Model Residuals. Advances in Mathematics Research, 12, 19-40.
Lonner, W. J., & Sandberg, N. D. (1985). Assessment in cross-cultural counselling and therapy. In P. Pedersen (Ed.), Handbook of cross-cultural counselling and therapy. Wesport: Greenwood Press.
Naglieri, J. (2003). Naglieri Nonverbal Ability Test Individual Administration MANUAL. The Psychological Corporation, a Harcourt Assessment Company.
Pearson Clinical Assessment Australia & New Zealand (2015). Retrieved from https://www.pearsonclinical.com.au/products
Powell, H., Mihalas, S., Onwuegbuzie, A., Suldo, S., & Daley, C. (2008). Mixed research in school psychology: A mixed methods investigation of trends in the literature. Psychology in the Schools, 45(4).
School Psychology Practice Handbook. (2015). Retrieved from z:\Student Services\Programs\Mental Health and Child Protection\School Psychologists\
Smith, E. (2002). Detecting and evaluating the impact of multidimensionality using item fit statistics and principal component analysis of residuals. Journal of Applied Measurement, 3(2), 205-231.
Special Education Support Program. (2015). Retrieved from http://ed.ntschools.net/edserv/Documents/Special Ed and Wellbeing/SESPform.docx
Swets, J. A. (1973). The relative operating characteristic in psychology. Science, New Series, 182, 990-1000.
Wechsler, D., & Naglieri, J. A. (2006). Wechsler Nonverbal Scale of Ability (WNV) MANUAL. Retrieved from https://www.pearsonclinical.com.au/products/view/214
Westerman, T. G. (2007). The value of unique service provision for Aboriginal Australians – the benefits of starting from scratch. Psychology and Indigenous Australians: Effective Teaching and Practice Conference, Adelaide.
Copyright information

This work is licensed under a Creative Commons Attribution-NonCommercial-NoDerivatives 4.0 International License.