Obstacles Faced by Students in Making Sense of Fractions

Abstract
The learning of fractional concepts is one of primary school students’ first experiences with a mathematics concept beyond the fundamental four basic operators. However, research has shown that students faced great difficulty in learning fractions which, to a large extent, inhibits their intuitive knowledge of it. The learning of fractions is foundational to the understanding of many more advanced areas of mathematics and science. Examining why they face problems making sense of fractions and what can be done about it is the main aim of this study. Utilizing a mixed method approach, a total of 173 students aged 13-14 were administered a paper and pencil test and then twelve students were selected for the interviews in probing their thought process in assessing their intuitive knowledge on fraction learning. The outcome of the paper and pencil test depicts a lack of intuitive knowledge in making sense of fractions with a low-level attainment of 38.67%. The findings from the interviews showed a growing concern of an overreliance on calculators, algorithm and procedures that inadvertently undermines the learner’s intuitive knowledge of learning fractions. We are of the view that the preconceived notion of 'practice makes perfect’ practices in current classrooms inhibits students’ development of intuitive knowledge in making sense of fractions learning.
Keywords: Making sense of fractions, decimals, intuitive knowledge, mathematical learning, learning
Introduction
Over the decade, various findings have shown that students are weak in mathematics especially in the context of making sense of their learning. Although various educational reforms and transformation has taken place over the years in enhancing the learning of mathematics in schools, the current iteration of mathematics learning in school is almost exclusively based on procedural orientation methodology of yesteryears that are not in tandem with the conceptual and meaningful learning processes of a learner. These sentiments in the 80s to 90s were elucidated by various researchers (Aksu, 1997; Resnick, 1987; Steffe, 1994). For example, Resnick (1987) was of the view that making sense of mathematics learning in schools was not being attained based on classroom pedagogical practices. Then in the 90s, Steffe (1994) similarly opined that:
The current notion of school mathematics is based almost exclusively on formal mathematical procedures and concepts that, of their nature, are very remote from the conceptual world of the children who are to learn them (p. 5).
These studies decades ago, elucidated various reasons for these shortcomings. Among them includes students who did not have the opportunity to study essential mathematics in some cases. In other cases, they were not engaged in the learning of the content and they often lacked the motivation to learn. They also questioned the quality of instruction in mathematics classrooms. Are these reasons still prevalent at the current time in math classroom practices? There's no doubt that the quality of mathematics education needs to be significantly enhanced.
The focus of this paper is towards micro learning of mathematics in the topic of fractions where we investigate students’ intuitive knowledge of this essential concept. According to Gutierrez (2017), the main difference between macro and micro learning is that the former focuses on the bigger picture of learning and, in this case, on mathematics in general whereas the latter focuses on a specific context of mathematics learning which, in this study, refers to the learning of fractions. What is intuitive knowledge? According to Pam (2013), intuitive knowledge is subjective judgement and knowledge that appears to be based on a gut feeling rather than specific learning. It is considered to be ‘unreflected’ knowledge (colloquially called a hunch) without conscious awareness (Rosenblatt & Thickstun, 1994) and it serves as a basis for judgement and decisions in learning processes. Intuitive knowledge can only be developed through meaningful prior learning experiences. The development of this ‘intuition’ knowledge is closely related with content knowledge in the context of fraction sense as the focal of this study.
Fraction sense “refers to a person's general understanding of fractions and operations along with the ability and inclination to use this understanding in flexible ways to make mathematical judgments and to develop useful strategies for handling fractions and operations” (McIntosh et al., 1992, p. 3). It is a sense that one acquires based on previously learnt experiences in solving similar problems. For instance, if one is asked to estimate the addition of 15/16 + 11/12, one would say about 2 or a little less. This is not precise but a good sense of it. In other words, intuitive knowledge in this study refers to “an intuitive understanding of fractions, their magnitude, relationships, and how they are affected by operations” (Hull et al., 2011, p. 108) based on learners’ prior knowledge.
Fractions relates to the division of two quantities namely the numerator and denominator or as a conceptualization of a part-whole unit. Making sense of fractions is one of the fundamental prerequisites for the development of intuitive knowledge in the learning of fractions. According to Reys and Yang (1998) students are able to recognize various representations of the same fractions, select and use benchmark fractions, manipulate fractional units, understand fraction magnitude and exercise flexibility in fractional operational strategies. In order to be able to develop and deepen students’ understanding of fractions, which means making meaningful sense of it, they need to explore, be engaged in the many representations and use it over a significant period of time in their classroom learning context. For example, one of the components in fractions is about equivalent forms of expression in relation to percentages and decimals. In this context, ½, 50% and 0.5 are equivalent forms of expression but its representation is used in different contexts. For instance, 50% is appropriate when we talk about a discount of the original price during a sale while ½ is appropriate when we talk about a portion of pizza or cake. So, students need to build their experiences dealing with fractions in various representations for meaningful learning to take place.
The learning of fractions is traditionally a difficult topic for many students (Charalambous & Pitta-Pantazi, 2007; Meert et al., 2010; Pitkethly & Hunting, 1996) especially when dealing with quantities in numerator and denominator. Pitkethly and Hunting (1996) posited that students view these two quantities as two separate entities of whole numbers instead of part-whole conceptualizations. These students then apply their procedural orientation literally with these whole numbers (Nunes & Bryant, 1996) and erroneously conceptualize 1/3 + 1/4 = 2/7 and also 1/4 >1/3. These types of errors are commonly made by students but the question is why? Then, these errors in fraction learning are further compounded especially in the context of the various operations involved in dealing with fractions such as addition, subtraction, multiplication, division, comparing and simplifying. When students face stumbling blocks in conceptualizing such operations, the common route taken will be based on memorization by the students and procedural orientation by the instructors.
Ekenstam (1977) elucidated 43 years ago that “the lack of understanding of what numerals mean must present insuperable barriers to learning mathematics" (p. 317). The core awareness of this understanding on the learning of fractions includes developing knowledge on the relationship between fractions, decimals and percentages together with the computation skills and these interrelated facts will allow the learner to access these concepts in various seamless ways. He further posited that a learner who could not cognize the various fractions between 1/3 and ½, or realizes that the estimated sum of is slightly more than one; or that is slightly less than two would have to rely on a plethora of computation procedures to seek the solutions which is inadvertently devoid of conceptual understanding. Does this elucidation by Ekenstam 43 years ago on the barriers to learning of mathematics still stand today?
Purpose of the Study
Based on these questions, this study investigates the obstacles faced by students in the learning of fractions especially with regard to making sense of it. It is commonly accepted that students are weak in fractions at the macro level and to answer the question ‘why’, we need to delve into the micro level of students learning of fractions. The outcome of this research hopefully provides empirical evidence which might clarify the “why” in the context of difficulties students face in the learning of fractions.
Research Question
The learning of fractions is foundational to many more advanced areas of mathematics and science and examining why they have such trouble with making sense of fractions and what can be done about it is the main aim of this study. Specifically, the research questions for this study are;
3.1 What is the students’ conceptual understanding of fractional sense based on their achievement in the paper and pencil test?
3.2 What are the difficulties and obstacles faced by students in making sense of fractional learning?
Research Methodology
This study utilised a mixed method approach where a total of 173 students ages 13 to 14 were administered a paper and pencil test and within these, a total of 12 students were selected to be interviewed. However, for this paper, the focus was on the qualitative section where the data was derived from four of these twelve students. These students were from public schools in a state in Malaysia. All these students followed the same curriculum and they were exposed to the learning of fractions since Primary 4.
The curriculum for fractions in the Malaysian school syllabus is divided into two main categories namely numbers and quantities. In the former category, students are exposed to counting, enumerating and classifying fractions together with decimals. This also includes computation, identification and solution of problems involving fractions and decimals relating to the basic four operations. In the latter category, they learnt to operate and fractionate quantities for comparison purposes. They are also exposed to adding and subtracting two units of fractions as well as relating it to percentages.
The aim of this study is to paint a picture of the difficulties faced by students in the learning of fractions using a qualitative approach via interviews. However, a paper and pencil test was adapted from McIntosh et al. (1992) to provide a glimpse of the level of students’ understanding of fractions. The test comprised 27 items related to fractions and student’s responses were recorded as correct or incorrect. Then, interviews were used to probe students’ conception of fractions focusing on the use of benchmarks ‘1’ and ‘½’, estimation and deciding the reasonableness of the results. Follow-up questions were further posed to elicit students’ conception of fractions.
Findings and Discussion
Table 1 shows the mean score obtained in the paper and pencil test administered among 173 students is 11.60 with a standard deviation of 3.71. The percentage level of students’ achievement in the Fraction Test is 38.67% which indicates a very low-level achievement in their fractional understanding.
The low mean score level is similar to the results obtained by Singh et al. (2019) where they investigated students making sense of numbers in general, which also included fractions. They found students faced great difficulty in conceptualizing numbers and elucidated that “if students are expected to make sense of how numbers are authentically used in their daily lives, they will need to first understand the nature of the numbers” (p. 2934). Similarly, as in this study, students appear to be still struggling to grasp the concept of fractional understanding.
The following section details the problems faced by students involved in the study related to their conception of fractions via the interviews. Only the responses of four students involved in the interviews are presented here and the coding used to identify them were S1, S2, S3, S4 and R for Researcher.
Assessing students’ ability in using benchmark of ‘1/2’ and ‘1’ for estimation
Two questions were posed to assess students’ ability to estimate the addition of two fractions. These questions were shown on a piece of paper.
Question 1: Without calculating an exact answer, circle the best estimate for:
A. 26B. 1C. 2D. 28E. the answer cannot be found without calculating
Findings from the paper and pencil test show that 78.2% (n=137) of the students obtained an incorrect answer for this question.
Below are excerpts of the interviews with students eliciting the difficulties they faced in answering this question.
The following part of the finding and discussion presents the verbatim with respondents 3 and 4 designated S3 and S4
S1: I need to use paper and pencil to do the working.
R: The question asks without calculating an exact answer, circle the best estimate… please try to estimate
After a while thinking (about 2 minutes)
R: Can you estimate the sum of the two fractions without paper and pencil?
S1: It is difficult.
R: Have you been asked to estimate these type of problems in school?
S1: No, we always find the answer using paper and pencil
S2 faced a similar difficulty in estimating the sum of the two given fractions.
S2: That is difficult
R: Why?
S2: How can I do without doing the calculation?
R: Have you done this type of questions in school…. that means to estimate?
S2: To estimate no…… but we use paper and pencil or the calculator to add fractions.
Another question was posed to ascertain S1 and S2’s ability to use estimation.
Question 2: Without using calculation, which total is more than 1?
A. B. C. D.
In the paper and pencil test, 70.5% (n=122) obtained an incorrect response with 29.8% and 31.0% selecting the incorrect responses of B and C respectively.
Both S1 and S2 were reminded to not use paper and pencil or a calculator to get the answer.
After pondering and performing some mental computation in his head for about 2 minutes or so
S1: The answer is D.
S1 spent about a minute in computing the answers mentally for each A, B, C and D. He wrote the answers for each on the worksheet.
R: Can you explain?
S1: The total for A is sixty-eight over seventy-seven (68/77), B is … (45 seconds pause) fifty-three over sixty (53/60) and C is … (pause 30 seconds) seventeen over eighteen (17/18). All A, B and C are less than one.
S1 insisted on using the computation method in reasoning his answer. He was good at it; however, he faced difficulty in reasoning using estimation.
S2 was then asked the same question but was told to estimate the answer.
S2 was silent for about a minute.
R: Look at A, five over eleven (5/11) and three over seven (3/7)… is the sum more than one, less than one or equal to one?
S2: Can I use my calculator?
R: I want you to estimate without the calculator.
She faced great difficulty and her facial expression showed that she was trying to compute the sum mentally.
R: What are you thinking?
S2: I am trying to do it in my head.
R: How are you doing it? Please say it aloud.
S2: Ok, for A, I am calculating thirty-five plus thirty-three and it is … err… sixty-eight… the total will be sixty-eight over seventy-seven.
R: How did you get thirty-five plus thirty-three?
S2: You see, the common denominator is seventy-seven, so I times[multiplied] five with seven and got thirty-five…. Then for the three I times with eleven and got thirty-three.
S2 was well versed with the addition of fractions where one needs to find the common denominator before adding the fractions. However, she faced great difficulty in using the benchmark of ‘1/2’ in in giving an estimate.
Both S1 and S2 faced great difficulty in making an estimate on the addition of two fractions. They did not have the intuitive knowledge of making sense on the estimation of the sum and insisted on using paper and pencil. Benchmarking of ‘1’ or ‘1/2’ as a fundamental requirement for estimation purposes in the fractional sense was not in their repertoire of skills and they relied solely on computation methods.
On the other hand, both S3 and S4 were successful in using the benchmark of ‘½’ and ‘1’ in providing the estimate for the solution. The following part of the finding and discussion presents the verbatim with interviewees 3 and 4 designated S3 and S4
S3: The answer is two (2)
R: Please explain
S3: Both the fractions (pointing to 15/16 and 11/12 in the paper) are nearly one, so, one and one gives two.
R: What do you mean nearly one?
S3: Both these fractions can be estimated as one
R: Why?
S3: Because to be one, it should be sixteen over sixteen…so, just less of one over sixteen…. It is small
R: (pointing to 11/12).
S3: It’s the same, to be one is twelve over twelve (12/12) …. Less by one over twelve.
S4: In each fraction of A and B, they are less than half. For example, in A, five “per” (over) eleven (5/11) and three “per” (over) seven (3/7) and also in B, seven per fifteen (7/15) and five per twelve (5/12), each are less than half (1/2) … so the total for A and B is less than one…For C, one per two (1/2) is half and four over nine is less than half…again the total is less than one.
R: What about D?
S4: It is more than one because five per nine is more than half and also eight per fifteen is more than half.
R: How do you know each is more than half?
S4: Quite simple, five per ten means half…if the denominator is less than ten...here is nine (pointing to nine) than it’s more half.
R: What about eight over fifteen?
S4: It’s the same…as it is less than eight per sixteen…here is fifteen….so more than half.
Both S3 and S4 used ‘1’ and ‘½’ as benchmark for each fraction in providing the estimate for the solution. They were aptly able to support their reasoning of the estimation with the symbolic representation of half and one both in terms of number and language. Their estimation using benchmarking depicts a clear representation of fraction as used in estimation. A benchmark is the description of a known quantity or number used to estimate an unknown quantity. The importance of the benchmarking approach was emphasized a decade ago while establishing conceptual fractional understanding (Clarke & Roche, 2009) and this was, thus, a very important strategy for including numerical estimation approaches that are specific to primary school in a taxonomy. The usage of benchmarking of ‘½’ and ‘1’ by both S3 and S4 depict it as an important step to develop meaning for the size of the fractions. This benchmarking assists students to build an intuitive feeling of ‘0’, ‘½’ and ‘1’. Learning the explanation why a fraction is near half or one helps students to develop a sense of how fractions operate.
Assessing Students’ Ability in Using Paper and Pencil Method
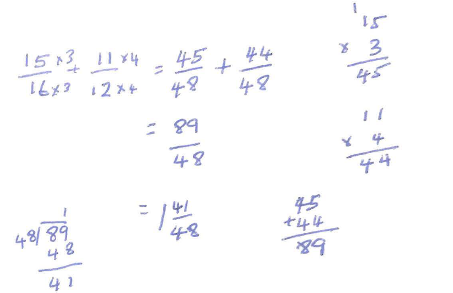
This section details both S1 and S2’s prowess in solving the addition of two fractions using the computation method with paper and pencil.
R: Have you been asked to estimate these types of problems in school?
S1: No, we always find the answer using paper and pencil.
R: How do you find the answer?
S1: We find the denominator first
R: Please show it to me.
He spent about 3 minutes or so in solving the problem as shown in Figure 1.
S2 also did not face any difficulty in solving the problem using the computation method as shown in Figure 2.
R: Have you done this type of questions in school…. that means to estimate?
S2: To estimate no…… but we use paper and pencil or the calculator to add fractions
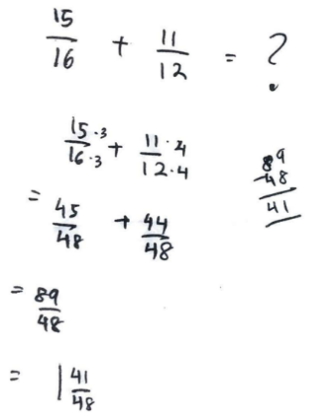
Both S1 and S2 were very efficient in using paper and pencil computation and even mental computation in finding the sum of the sum of the two fractions. However, an over-reliance on computation methods namely using paper and pencil method and calculator would curb their development of intuitive knowledge in making sense of fractions. They did not have the repertoire of using the benchmarks ‘1/2’ or ‘1’ due to an over-emphasis of computational methods in classroom teaching that inadvertently did not help them to develop the intuition of making sense of fractions.
This section assesses students’ ability to represent fractions in a graphical representation.
R: I want you to represent in graphical representation?
S1: This is ‘pecahan tidak wajar’ (improper fraction) …. so, cannot draw as a pie (representation)
R: Why not?
S1: because the top ten (10 as numerator) is bigger than the denominator nine (9).
R: Can you draw four over nine for me?
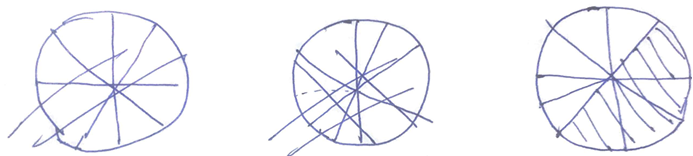
She started to draw a circle and divided it into nine equal sections but faced difficulty and cancelled it quite a number of times (Refer Figure 3).
R: Is four over nine more or less than half?
Looking at her sketchily drawn circle
S2: It is half
R: Why do you say that?
S2: Based on my drawing (pointing to the drawn circle) it is half…. I am not sure…. cannot be, my drawing is not correct.
S2 was in deep thought.
S2: Less than half… Because four over eight will be half… so, four over nine should be less than half.
R: Can you draw or represent four over nine other than in a circle?
S2: I am not sure because we always use a circle to show fraction in classroom.
R: It is ok…can you try to represent in graphical representation?
After some deep thought.
S2: No… cannot… cos the top (ten) is more than the bottom (nine)
R: Why not?
S2: When we draw in a circle in fraction, always the bottom (denominator) should be more…example two over three … three over four…the bottom always should be more
S4 was also asked to represent and
R: I want you to represent ten over nine (10/9) and seven over six (7/6) in a graphical representation.
S4: Draw it?
R: Yes
S4 was thinking for a while and I assumed he was facing some difficulty.
R: Can you represent ten over nine (10/9) as a mixed number?
S4: Is it one one over nine (1 1/9)?
R:
R: What about seven over six (7/6)?
S4: One one over six (1 1/6)
R: Now can you represent both ten over nine (10/9) and seven over six (7/6) in a graphical representation?
S4: We have not done this in school as we usually draw fraction for less than one… I will try
S4 worked for quite a while on a sheet of paper (refer Figure 4)
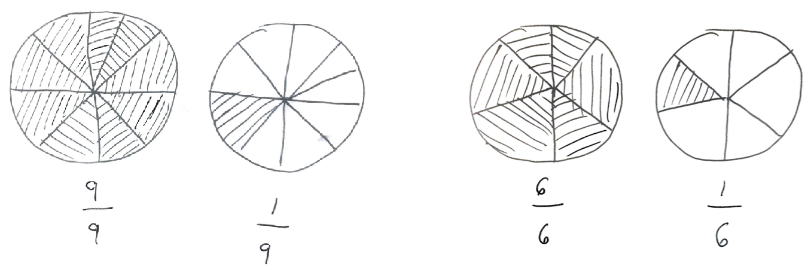
S4 was able to represent both and as graphical representations of mixed numbers.
S1 and S2 faced great difficulty in conceptualizing improper fractions (10/9) in a graphical representation. They were of the opinion that fractions can only be less that one. This indicates that both S1and S2 had a limited conception of the ‘1’ and fraction benchmark relationship. This, to a large extent, stems from the teaching of fractions using the part whole concept where the part is always less than the whole. On the other hand, S4 did face some initial difficulty in representing 10/9 in graphically, but was successful after some probing.
Conclusion
The findings from the paper and pencil test in assessing students’ sense of fraction proficiency among 173 students sampled in this study was 11.60 (SD=3.71) from a maximum score of 30. In other words, the percentage score obtained was a low 38.6% depicting low-level test scores in the Fractional Sense Test. This test measured students’ enumeration of fraction sense where students were to provide the answers without the aid of paper and pencil. Making sense of fractions simply “refers to a person's general understanding of fractions and operations along with the ability and inclination to use this understanding in flexible ways to make mathematical judgments and to develop useful strategies for handling fractions and operations" (McIntosh et al., p. 3). The findings seem to indicate that the current learning of fraction concepts in Malaysian classrooms is limited to the superficial acquisition of knowledge and definitely requires some drastic reforms.
The findings from the qualitative analysis via interviews uncovered an over-reliance on algorithms and procedures which is a worrying trend because it inadvertently undermines learners’ intuitive knowledge of making sense in the learning of fractions. From the interviews, both S1 and S2 faced great difficulty in making an estimate on the addition of two fractions and . They were well versed in the computation process on the addition of these two fractions but were unable to estimate the answer using benchmarking (either ‘½’ or ‘1’) and insisted on using paper and pencil. Findings have indicated that that using calculators or an over-reliance of paper and pencil computation does, to a large extent, curb the development of number sense. This was eloquently elucidated by Stephen Wilson (n.d.) “using a calculator is akin to relying on a crutch when one doesn’t have a bad leg”. The implication here is that over-reliance on these tools does not enhance students’ making sense of numbers that inhibits the development of intuitive knowledge especially in the context of estimation.
Although educators about four decades ago generally agreed that estimation is a major part of the math curriculum, it was not emphasized in schools (Reys & Bestgen, 1981) and today’s classroom maths learning is dominated by paper and pencil computation. Teachers consider estimation ambiguous while students believe that only one correct answer is possible with mathematics (Yoshikawa, 1994). There are several reasons why estimation is not being emphasized. Swan (2002) claimed that both students and teachers focus on exact computation for accuracy in final answers rather than using estimation. Verschaffel et al. (2007) believed that it was difficult for students to estimate which could be a reason why it was hardly emphasized in classroom learning. It is disconcerting that, despite its importance in students’ sense making of concepts like fractions, the usage of estimation is not being emphasized in classroom mathematics learning.
Making sense of fractions is one of the fundamental prerequisites for meaningful learning of fractions. Making sense refers to the capacity of students in recognizing different representations of the same fraction, identifying and using benchmarks of making estimations of the reasonableness of answer, and exercise versatility in fractional computation strategies (Reys & Yang, 1998). Both S1 and S2 were not equipped with benchmark repertoires in making fundamental estimation for the sum of two fractions. According to Gojak and Miles (2015), benchmarking helps students to explain their reasoning in oral and written explanations to decide whether the answer is reasonable using comparisons, mental add-ons or subtractions. This study depicts that both S1 and S2 do not have an adequate representation of benchmarking repertoire in finding estimates as being a fundamental requirement of constructing intuitive knowledge of making sense of fractions. On the other hand, both S3 and S4 were versatile in their explanation of making sense in the relationship between the benchmarks ‘½’ and ‘1’ and estimation in making sense of fraction.
Another difficulty faced by students was in representing fractions in graphical representation. Both S1 and S2 use only a circle to represent a fraction and were not able to do it in different forms such as using rectangles. It was found that teachers very often use a circle as a geometric shape in their classroom lessons to represent fractions. For example, when S2 was asked to represent 4/9 in a different graphical representation than a circle, the reply was
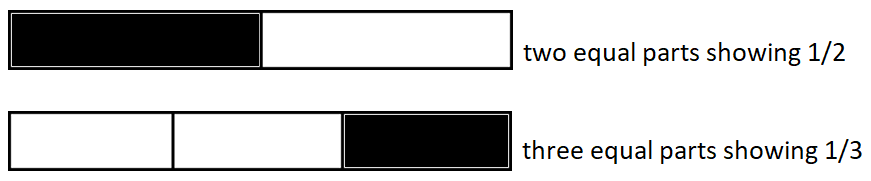
It is important to note that other geometrical representation forms can also be divided in equal parts other than a circle. For instance, a rectangle can be used to represent a whole, and it can be broken it into parts. For example, a rectangle (refer Figure 5) can be divided into two or three equal parts of a whole to illustrate the conceptualization of fractions.
The early or initial way to learn fractions is through visualization where it develops intuitive knowledge of fractions representation. According to Arcavi (2003):
Visualization is the ability, the process and the product of creation, interpretation, use of and reflection upon pictures, images, diagrams, in our minds, on paper or with technological tools, with the purpose of depicting and communicating information, thinking about and developing previously unknown ideas and advancing understandings. (p. 217)
This description emphasizes that visualizations can be a compelling device in mathematics learning in exploring math problems and giving meaning to mathematical concepts and their connections. Thus, teachers need to emphasize different modes of geometrical representation to enhance students’ visualization process in the learning of fractions.
Fractions for school children are seen as a stumbling block and it is well elucidated in the literature. One of the fundamental stumbling blocks is the way students are exposed to the definition of fractions. The common definition for it is “”. Students are typically taught fraction as a/b where a (numerator) is the smaller number and b (denominator) as the bigger number using the part-whole conceptualization. This was the rationale provided by both S1 and S2 in their inability to represent and in a graphical representation. One of the reasons for this fundamental flaw is because students at early levels are only exposed to fraction shading of a graphical representation (usually a circle) of such as , , , ,
and so on, that is less than 1. Using graphical representation of improper fractions such as 3/2, 5/3, 7/6 is hardly conceptualized in classroom learning. These difficulties of students’ graphical representation of improper fractions were well reported by previous research findings (Gabriel et al., 2013; Tzur, 1999) and still persists in today’s classroom.
Fractional learning has historically been a subject where many students face difficulty (Charalambous & Pitta-Pantazi, 2007; Meert et al., 2010; Pitkethly & Hunting, 1996). If students’ understanding in meaningful development of fraction learning collides with stumbling blocks, the standard approach usually taken is based on computation procedures methods using paper and pencil and calculators (Verschaffel et al., 2007). This study somewhat verifies this claim based on S1 and S2’s repertoire where an over-reliance on computation inhibits their development of reasoning with fractions especially in the context of estimation.
Early development of arithmetic skills such as the four basic operators, recognition of integers, and relationship among decimals and percentages is the entry point into the learning of fractions. These fundamental skills are taught to students during their early years of primary education. However, these skills as a prerequisite for the development of fraction learning are often difficult for them to acquire. The inability to grasp such skills in advance, during the early elementary stage results in eventual difficulty in mathematical learning as the students’ progress further. We are of the view that the typical way they are taught is one of the fundamental hurdles preventing meaningful fraction learning. Researchers have stated that the number of operation rules for students to learn about fractions such as adding, multiplying, subtracting, dividing and comparing complicates their grasp. This is further compounded with the variability in dealing the with numerators and denominators. According to Yang et al. (2007), an emphasis on sense making in the teaching process by teachers will be reciprocated in the learning process by students and they will eventually realize its importance as compared to the formulaic structures associated with procedural orientation.
We would like to conclude this paper with a reminder for educators and curriculum developers to ponder a statement by Aksu (1997), “A common error in teaching fractions is to have students begin computation before they have adequate background to profit from such operations” (p. 375).
Acknowledgments
The authors would like to thank Universiti Teknologi MARA Selangor, Malaysia and Ministry of Education Malaysia for funding this project under the Fundamental Research Grant Scheme (FRGS).
References
Aksu, M. (1997). Student performance in dealing with fractions. The Journal of Educational Research, 90(6), 375-380.
Arcavi, A. (2003). The Role of Visual Representations in the Learning of Mathematics. Educational Studies in Mathematics, 52, 215 -241.
Charalambous, C., & Pitta-Pantazi, D. (2007). Drawing on a theoretical model to study students' understandings of fractions. Educational Studies in Mathematic, 64, 293–316.
Clarke, D., & Roche, A. (2009). Students’ fraction comparison strategies as a window into robust understanding and possible pointers for instruction. Educational Studies in Mathematics, 72(1), 127-138.
Ekenstam, A. A. (1977). On children's quantitative understanding of numbers. Educational Studies in Mathematics, 8, 317–332.
Gabriel, F., Coché, F., Szucs, D., Carette, V., Rey, B., & Content, A. (2013). A componential view of children's difficulties in learning fractions. Frontiers in psychology, 4, 715.
Gojak, L. M., & Miles, R. H. (2015). The Common Core Mathematics Companion: The Standards Decoded, Grades 3-5: What They Say, What They Mean, How to Teach Them. Corwin Press.
Gutierrez, K. (2017). When Designing Microlearning, Keep Macro in Mind. https://www.shiftelearning.com/blog/micro-learning-macro-learning
Hull, T. D., Balka, D. S., & Miles, R. H. (2011). Visible Thinking in the K–8 Mathematics Classroom. Corwin Press Inc.
McIntosh, A., Reys, B. J., & Reys, R. E. (1992). A proposed framework for examining basic number sense. For the Learning of Mathematics, 12, 2-8. https://www.jstor.org/stable/40248053
Meert, G., Grégoire, J., & Noël, M. P. (2010). Comparing the magnitude of two fractions with common components: which representations are used by 10 - and 12-year-olds? Journal of Experimental Child Psychology, 107(3), 244-259.
Nunes, T., & Bryant, P. (1996). Children doing mathematics. Blackwell.
Pam, N. M. S. (2013, Maty 11). Intuitive Knowledge. PsychologyDictionary.org. https://psychologydictionary.org/intuitive-knowledge/
Pitkethly, A., & Hunting, R. (1996). A review of recent research in the area of initial fraction concepts. Educational Studies in Mathematics, 30, 5-38.
Resnick, L. B. (1987). Learning in school and out, Educational Researcher, 16, 13-20.
Reys, R. E., & Yang, D. C. (1998). Relationship between computational performance and number sense among sixth- and eighth- students in Taiwan. Journal for Research in Mathematics Education, 29(2), 225-237.
Reys, R. E., & Bestgen, B. J. (1981). Teaching and assessing computational estimation skills. The Elementary School Journal, 82(2), 117–127.
Rosenblatt, A. D., & Thickstun, J. T. (1994). Intuition and Consciousness. The Psychoanalytic Quarterly, 63(4), 696-714.
Singh, P., Abdul Rahman, N., Ramly, A., & Teoh, S. H. (2019). From Nonsense to Number Sense: Enumeration of Numbers in Maths Classroom Learning. European Journal of Social & Behavioural Sciences, 25, 2933-2947.
Steffe, L. P. (1994). Children’s multiplying schemes. In G. Harel, & J. Confrey (Eds.), The development of multiplicative reasoning in the learning of mathematics (pp. 3 – 40). State University of New York Press.
Swan, P. (2002). The computation choices made by students in years 5 to 7. https://ro.ecu.edu.au/cgi/viewcontent.cgi?article=1735&context=theses
Tzur, R. (1999). An integrated study of children’s construction of improper fractions and the teacher’s role in promoting that learning, Journal for Research in Mathematics Education, 30, 390-416.
Verschaffel, L., Greer, B., & De Corte, E. (2007). Whole number concepts and operations. In F. Lester (Ed.), Second Handbook of Research on Mathematics Teaching and Learning (pp. 557-628). Information Age Publishing Inc.
Wilson, S. (n.d.). Short response to Tunis’s letter to the editor on technology in college. http://www.math.jhu.edu/~wsw/ED/response6.pdf
Yang, D. H., Reys, R. E., & Reys, B. J. (2007). Number Sense Strategies Used by Pre-Service Teachers in Taiwan, International Journal of Science and Mathematics Education, 7(2), 383-403.
Yoshikawa, S. (1994). Similarities and differences—computational estimation in Japan and the United States. In B. Reys, & N. Nohda (Eds.), Computational alternatives for the twenty-first century (pp. 48–62). NCTM.
Copyright information

This work is licensed under a Creative Commons Attribution-NonCommercial-NoDerivatives 4.0 International License.