
A Heuristic Model to Measure Nonprofit Management Deficiency

Abstract
A mathematical technique to measure nonprofit management performance has eluded researchers for more than three decades. Traditional, analytical techniques have failed to find a solution that has broad acceptance. This problem raised the following question: will heuristic methodology provide an acceptable, approximate solution to the measurement of individual management deficiency in a nonprofit organisation? The purpose of this study was to demonstrate that a heuristic methodology can be used to build a model that will measure individual management deficiency and produce an assessment of management strengths and weaknesses for the board members of nonprofit organisations. The heuristic methodology known as simulated annealing was adopted in an attempt to find an acceptable, approximate solution to the measurement of individual management deficiency. A heuristic model was built and tested and satisfactory results were obtained. The results were validated by demonstrating that there was an alignment of the results produced by the heuristic model and those obtained by an alternate method. Therefore, it has been established that this heuristic model will produce an acceptable, approximate solution to the measurement of management deficiency across a wide range of factors in non-profit board members.
Keywords: Management deficiency, non-profit, heuristic model
Introduction
For nonprofit organisations, research has established that there is a strong correlation between board performance and organisational performance (McDonagh, 2006; Nicholson, Newton, & McGregor-Lowndes, 2012; Willems, Huybrechts, Jegers, Weijters, Vantibborgh, Didee, & Pepermans, 2012). The implication of this finding is that improving the performance of the board will lead to improvement in the performance of the organisation. To improve their performance, nonprofit management teams need actionable information that will enable them to identify their strengths and weaknesses (McDonagh, 2006; Nicholson, Newton, & McGregor-Lowndes, 2012).
Current models used to measure the performance of nonprofit boards are often difficult to implement with a considerable delay before results are available or they produce results that have not been rigorously tested to validate the accuracy of their measurement of performance (Heiberg & Bruno-van Vijfeijken, 2009; Herman & Renz, 2006). Many studies have attempted to develop models that can measure nonprofit management performance but the results are generally inconclusive leading to a lack of consensus as to which is the best approach (Herman, 1990; Moxham, 2010; Taysir & Taysir, 2012). There is no agreement that one performance measurement model is better than another and the findings from one study sometimes do not support the findings of another study (Cornforth, 2012; Barnard & Lesirge, 2012; Bhardwaj & Vuyyuri, 2005; Holland, Chait, & Taylor, 1989; Ostrower & Stone 2010). There is also a positivist orientation evident in the current approach (Cornforth, 2012), looking at how well the board as a whole carries out their responsibilities. The result is a lack of focus on management deficiencies and individual board member competencies.
Problem Statement
Researchers have been trying to develop a technique for measuring management deficiency in a nonprofit organisation (NPO) for more than 30 years. Traditional, analytical techniques have failed to find a solution that has broad acceptance.
Research Question
Will heuristic methodology provide an acceptable, approximate solution to the measurement of management deficiency in a nonprofit organisation?
Purpose of the Study
The purpose of this study was to demonstrate that the factors that contribute to management deficiency in an NPO can be identified and measured using a heuristic methodology. The objective was to build a heuristic model that will measure individual management deficiency and produce an assessment of management strengths and weaknesses for the board members of non-profit organisations.
Research Methods
Defining the Adopted Approach
There is a direct relationship between nonprofit board performance and the overall performance of the organisation (Alexander, Hearld, & Mittler 2011; McDonagh, 2006; Nicholson, Newton, & McGregor-Lowndes, 2012; Willems, Huybrechts, Jegers, Weijters, Vantibborgh, Didee & Pepermans, 2012). It follows that poor board performance will result in poor performance for the organisation. Further, it is reasonable to assume that, if a board is performing poorly then that is largely attributable to the competencies and personal attributes of the individual board members (Balduck, Rossem, & Buelens, 2010). There is also evidence that most nonprofit organisation failures are the result of inexperienced, week management (Productivity Commission, 2010). In other words, management deficiencies are the primary cause of NPO failures. Therefore it is equally important to investigate why a board is performing poorly as it is to investigate what leads to a board performing well. Identifying the individual management deficiencies of board members would provide a management team with actionable information that would assist them to target their management development programme to addresses areas of weakness.
The findings from the literature and the argument presented above supported two conclusions. Firstly, research should focus on the individual competencies and personal attributes of board members which have been found to be associated with management performance. Secondly, the approach should be to measure deficiency in the identified competencies and personal attributes. There was also substantial agreement in the literature that a multi-dimensional approach is required (Brown, 2007; Cornforth, 2001; Jackson & Holland, 1998; Moxham, 2010; Willems, Huybrechts, Jegers, Weijters, Vantibborgh, Didee, & Pepermans 2012) and that developing a model framework is a useful tool for identifying the factors that are associated with management performance (Cornforth, 2001; Green & Griesinger 1996; Herman & Renz, 1997; Moxham, 2010; Sawhill & Williams, 2001). This study adopted a multi-dimensional/model framework approach to help identify the factors associated with management deficiency.
The literature supports the view that, in a situation where a problem involves a large number of variables with the relationship between them unknown and no solution can be found by traditional methods, a heuristic approach can provide an acceptable, approximate solution (Gilli & Schumann 2012; Satoglu, Durmusoglu, & Ertay 2010; Tempelmeier & Buschkuhl 2009). This situation can be applied directly to the present state of research into the measurement of nonprofit management performance. Therefore, it was logical to adopt a heuristic approach to try and find an acceptable, approximate solution. As a mathematical technique for finding acceptable, approximate solutions to complex problems, heuristic models have been in use for over 30 years.
A thorough search of the literature failed to find any report of a heuristic approach being used to solve a management performance measurement problem. Therefore, this study took heuristic modelling into an entirely new field which required the development of subjective techniques to identify and measure the dimensions of management performance. It was then necessary to build a heuristic model with no existing template to serve as reference. The model then had to be tested and the results validated.
Building the Model Framework
The first step towards building the model framework was to identify the main responsibilities of an NPO board. The review of the literature and interviews with NPO board members led to the identification of seven main responsibilities of a board which are presented below:
1) Achieve the objectives set out in the mission statement (Alexander, Hearld, & Mittler 2011; Bagnoli & Megali, 2011; Epstein & McFarlan, 2011; Forbes, 1998; Herman & Renz, 2002; Mwenja & Lewis, 2009; Sawhill & Williamson, 2001). The community service the NPO provides forms the basis of the organisation’s mission statement upon which the objectives are based. The reason the organisation exists is to fulfil its mission by working towards the achievement of its objectives. Achieving the objectives is the main responsibility of the board.
2) Oversee financial control (Epstein & McFarlan 2011; Forbes 1998; Green and Griesinger 1996; Harrison & Sexton, 2004; Langabeer & Galeener, 2007; Productivity Commission 2010; Taysir & Taysir 2012; Tucker 2010). Sound financial management based on having good accounting practices and financial reporting in place is vital for the detection of fraudulent practices and ensuring the financial viability of the organisation.
3) Income generation (Forbes, 1998; Harrison & Sexton, 2004; Productivity Commission, 2010; Tucker, 2010; Tucker & Parker, 2013). Income generation is directly related to sustainability. If the organisation is not generating enough income to meet its operating expenses then it will run at a loss and if this situation continues it will fail.
4) Communication (Bhardwaj & Vuyyuri, 2005; Doherty & Hoye, 2011; Widmer, 1993). The board is responsible for ensuring that the proper vehicles are in place for efficient communication. Poor communication can lead to conflict and confusion between the board and the members of the organisation.
5) Strategic planning (Bhardwaj & Vuyyuri, 2005; Brown, 2005; Brown & Iverson 2004; Forbes, 1998; Green & Griesinger, 1996; Herman & Renz 2002; Jackson & Holland, 1998; Langabeer & Galeener, 2007; Tucker & Parker 2013; Willems, Huybrechts, Jegers, Weijters, Vantibborgh, Didee and Pepermans 2012). There is broad agreement in the literature that having a strategic plan in place and board participation in the strategic planning process are major factors contributing to good organisational performance.
6) Meet legal obligations (Productivity Commission, 2010). Governments at different levels place legal requirements on nonprofit organisations which are usually associated with taxation and other concessions and the organisation’s ability to access government funding. In addition, certain legal obligations are placed on board members to manage the affairs and assets of the organisation they serve in an appropriate manner. Board members need to be aware of their legal obligations.
7) Oversee asset management. For NPOs that own their home premises and other property, asset management is an important responsibility of the board. There may also be financial assets to manage as well as vehicles and other equipment.
Having identified the main areas of responsibility for an NPO board, the next step in building the model framework was to identify the competencies and personal attributes, collectively referred to as factors, required by the individual board members to carry out these responsibilities. Three main competencies were identified: management skills (Cornforth 2001; Forbes 1998; Green and Griesinger 1996; Langabeer and Galeener 2007; McDonagh 2006; Nicholson, Newton and McGregor-Lowndes 2012; Parker 2007; Schjoedt and Kraus 2009; Thach and Thompson 2007; Tucker and Parker 2013; Willems, Huybrechts, Jegers, Weijters, Vantibborgh, Didee, & Pepermans 2012), management experience (Brown, 2007; Nafukho, 2007; Schjoedt & Kraus 2009; Thach & Thompson, 2007) and knowledge (Brown, 2007; Nafukho, 2007; Schjoedt & Kraus, 2009; Thach & Thompson, 2007). In addition to these competencies three personal attributes were identified: commitment to the organisation (Allen & Meyer, 1996; Cornforth, 2001; Doherty & Hoye, 2011; Preston & Brown 2004), age (Glisky, 2007), and resistance to change (Taysir & Taysir, 2012).
Age as a factor affecting management performance receives little attention in the literature. While there is wide variation between individuals, medical research has found that, in general, an individual’s ability to perform higher level cognitive functions declines as the brain ages (Glisky, 2007). Medical research has established that the effects of aging of the brain are evident by age 70 years. The main effect impacting management performance is a reduced ability to perform higher level problem solving and decision making. The inclusion of resistance to change as a factor to be considered when measuring management deficiency is only supported by one reference in the literature (Taysir & Taysir, 2012) and yet the existence of resistance to change within a board can have a detrimental effect in a number of areas:
- Reviewing the organisation’s objectives set out in its mission statement to ensure it remains relevant in the present operating environment.
- Implementing new policies and procedures.
- Updating existing practices to incorporate new ideas and technology.
- Making physical changes to improve facilities.
- Updating the organisation’s image with new advertising and promotional material.
- Introducing new types of activities to achieve the organisation’s objectives.
- Encouraging new members to join the organisation.
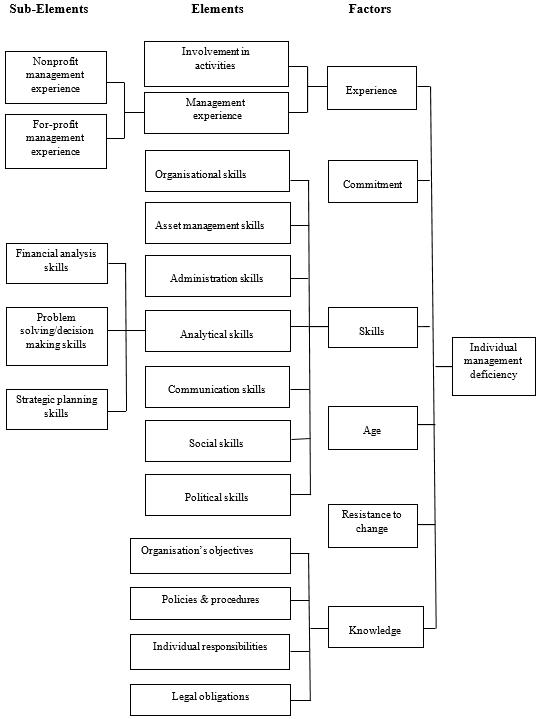
Therefore, it is important to measure the extent to which resistance to change exists within a board. Some of the factors were broken down into more specific elements and sub-elements for measurement purposes. The factors and elements identified are presented in Figure 1 which also illustrates the structure of the heuristic model.
Measuring the Factors
The data collection instrument adopted for this study was a self administered questionnaire. A self administered questionnaire has been used by other researchers in this field and it is claimed to produce reliable results (Jackson & Holland 1998; Willems, Huybrechts, Jegers, Weijters, Vantibborgh, Didee, & Pepermans 2012). However the questionnaire has to be carefully designed to effectively measure each factor and reduce the effect of response bias as much as possible (McColl et al., 2001; Paulhus, 1991; Peer & Gambiel, 2011; Rogelberg & Stanton, 2007; Villar, 2008).
Techniques for measuring the identified competencies and personal attributes were developed using subjective, qualitative techniques based on findings in the literature. The level of deficiency in each factor was measured by formulating one or more questions which were carefully designed to measure some aspect of the factor. A 5 point Likert-type scale ranging from 1 to 5 was used to record responses as this scale is commonly used. However, a scale of 0 to 4 was considered to be more logical for deficiency measurements as 0 would correspond to no deficiency. Therefore, when responses were processed, a measure of deficiency was obtained by reversing the scale for those questions that measured efficiency, and then 1 was subtracted from the reversed response to produce a response range from 0 to 4. This process is illustrated in the following example where the respondent has marked 2 as their response:
To record this response, first the scale would be reversed and the response of 2 would be recorded as 4. Then 1 would be subtracted to give a modified deficiency response measurement of 3.
Building the Heuristic Model
The model framework presented in Figure 1 provided the structure for the heuristic model. At this point it should be mentioned that issues of multicollinearity and the need to use factor analysis to determine the least number of variables that account for the variation in individual levels of deficiency are not relevant as the heuristic methodology adopted for this study is not seeking to establish the true nature of the relationship between the variables.
There are many general heuristic modelling techniques available. The one selected as being most suitable for this study was the technique known as simulated annealing (Kirkpatrick, Gelatt, & Vecchi, 1983). Following this technique, assumptions are made to simplify a complex problem so that a model can be developed that will provide an initial solution. From the initial solution, small refinements to the model produce new solutions which are plotted to determine the direction in which they are heading. If the new solution is better than the previous one it is accepted and the process continues. If a new solution is worse, it is not immediately rejected as a local maximum or minimum may have been encountered. The process usually continues until the plotted solution path indicates that the model has reached an optimal state.
The heuristic model development process began by assuming that the dependent variable, individual management deficiency, is a function of the independent variables: individual competencies and personal attributes, which are collectively referred to as factors. The relationship between the independent variables is not known, therefore a possible relationship needed to be selected for the initial form of the model. Heuristic methodology seeks to simplify a complex problem as much as possible so that a feasible initial solution can be found. Therefore complex, higher order relationships were not considered. Instead it was assumed that an additive or linear functional relationship exists between the independent variables. With an assumption of linearity the individual management deficiency equation can be written as:
d = + + + + + + where
d = individual management deficiency
= skills factor = experience factor = knowledge factor
= commitment factor = resistance to change factor = age factor
is a constant = factor coefficients ( i = 1, 2, ...6)
The constant term, , represents the questionnaire response bias error for the respondent. When data is collected using a self administered questionnaire, response bias is a legitimate aspect of the variable being measured (Paulhus 1991). Therefore, it must be assumed that there will be some degree of response bias in the data for each individual respondent. The technique that was used to estimate the level of response bias required data to be collected from a sample of NPO board members. As that data was not available until a later stage in the model development process, for the initial form of the model it was assumed that the response bias error is zero. That is, = 0.
The coefficients, , of each independent variable are unknown but if each factor is equally important in determining the level of individual deficiency then the coefficients of the independent variables would be 1. The initial form of the individual management deficiency equation became:
d = + + + + +
A similar approach was adopted for defining the initial relationship between the factors and their elements and between the elements and their sub-elements, where appropriate, according the model structure illustrated in Figure 1. The overall measurement of management deficiency for the board, D, was defined to be the average of the individual management deficiency measurements, d. That is:
orD =
where n = the number of board members
With the assumption of an additive relationship between the variables it was evident from the model structure presented in Figure 1 that the measurement of deficiency is accumulated from the sub-elements through the structure of the model to the measurement of individual deficiency. The questionnaire designed to collect the data contains 36 questions, each with a possible value ranging from 0 to 4. Therefore, the possible range of values for the measurement of individual deficiency was 0 to 144. An individual deficiency measurement from this range would have no meaning unless it could be related to the maximum possible value of the measurement. In addition, each factor, element and sub-element would have a different possible range of values for its deficiency measurement making comparisons between them difficult. As this situation was clearly not desirable, the response to each question was divided by the maximum possible response of 4 to convert the measurement to a ratio with a value between 0 and 1. At each stage of the model where responses were aggregated, the average was calculated to return the deficiency measurement to a value between 0 and 1. This averaging process was then built into the equations of the model. The equation for individual management deficiency, d, became:
Feeding into this equation, similar linear equations were developed from the structure of the heuristic model illustrated in Figure 1 to calculate the value of the skills factor, , the experience factor, , and the knowledge factor, . The equation for measuring overall board management deficiency remained unchanged at:
Testing the Initial Form of the Model
The initial form of the model was tested using data collected from a sample of six board members of an NPO. The data was entered into a Questionnaire Analysis Spreadsheet which was designed to convert the initial responses into deficiency ratios. The spreadsheet performed the desired aggregation of the data to obtain a value for each independent variable which were then entered into the equations that form the model. The model then produced deficiency measurements for sub-elements, elements, factors, individual management deficiency and, finally, a management deficiency measurement for the board. A summary of the results produced by the initial form of the model is presented in Table 1.
The model produced individual deficiency measurements ranging from 0.209 to 0.502 or 20.9% to 50.2%. For the results to be meaningful they must lie within the expected range from 0 to 1 or 0% to 100% deficiency. For the results to be acceptable they should not be extreme (lying close to the extremities of the range of possible values) and variation in individual deficiency ratios should be evident. Following these definitions, the results obtained were meaningful and acceptable in terms of their absolute value and range. They also demonstrated that the model, even in its initial form, was able to differentiate between the level of deficiency in individual competencies and personal attributes of the board members. The full set of results demonstrated that the initial form of the model can provide an assessment of individual board member strengths and weaknesses across a wide range of factors.
Estimating Questionnaire Response Bias
In the initial form of the heuristic model, questionnaire response bias was assumed to be 0 as no data was available at that stage to estimate the level of response bias. Paulhus (1991) claimed that an estimate of response bias can be obtained by establishing the distribution of the raw scores obtained from a sample and comparing this with the expected distribution of the population. This approach was adopted to obtain an initial estimate of questionnaire response bias.
The population of individual deficiency measurements was assumed to be normally distributed with a mean of 50% deficiency or 0.500. Effectively, the assumption being made here is that an average NPO board member is equally balanced between being deficient in some personal attributes and areas of competency and efficient in other areas. This mean was compared with the mean of the individual deficiency measurements derived from the sample used to test the initial form of the model which was 35.1% or 0.351. Using the sample mean as an estimate of the population mean, the difference between the two means, 0.149, would represent an estimate of the level of questionnaire response bias as illustrated below:
Sample mean = 0.351.
Estimate of the population mean = 0.500
Estimated Questionnaire Response Bias = 0.500 – 0.351
= 0.149
As this result is a preliminary estimate based on a small sample, the result was rounded down to 0.1 to provide an initial estimate of questionnaire response bias. Using an estimate of 0.1 for questionnaire response bias the equation for individual management deficiency became:
whered = individual management deficiency and are the factors
Estimating questionnaire response bias represented the first refinement to the model and the start of the simulated annealing model development process.
Refining the Model
In its initial form, the coefficients of each independent variable in the set of equations that comprise the model were assumed to be 1. Taking each of the model’s equations in turn, the literature was searched for research findings that enabled the independent variables to be ranked in order of their importance in determining the value of the dependent variable. The independent variables were then given weights according to their ranking.
No analytical technique could be found that would assist in quantifying the weights. However, there is reference in the literature to a study conducted by Nooriafshar and Vibert (2012) who estimated the coefficients of the independent variables in their heuristic model by ranking the factors according to their perceived importance. They then applied weighting to the factors using values obtained by reversing the rank order. In this way, the most important factor received the highest weight and the least important factor received the lowest weight. This approach was adopted for this study. The weights then became the coefficients of the independent variables in the model’s equations. This process is illustrated in Table 2.
The weights allocated to the six factors became estimates of their coefficients in the individual management deficiency equation. The model was then refined to include these coefficients. The equation for individual management deficiency was defined earlier to be:
d = 0.1 + ( )
To incorporate the weights listed in Table 2 into this formula, the coefficients of the expression
became:
It was established earlier that deficiency measurement should be standardized to a range of 0 to 1 to allow meaningful comparisons to be made. Adding weightings to the coefficients of the factors changed the deficiency measurement range from 0 to 6 to a range of 0 to 21. Therefore, it was necessary to divide the summation
by 21 to return the deficiency measurement for individual management deficiency to a range of 0 to 1. The formula for calculating individual management deficiency then became:
d = 0.1 + ( )or
d = 0.1 + 0.286
The same refinement process outlined above was applied to each of the model’s equations in turn which represented in total a series of seven refinements carried out on the model.
Tracking New Solutions: Refinements 1 to 7
Following the simulated annealing heuristic model development process, each refinement to the model generated a new solution to the measurement of management deficiency which was tracked to determine whether the new solutions were following a solution path. The solutions obtained for overall board management deficiency from the seven refinements to the model are displayed in Table 3 below.
The data displayed in Table 3 is illustrated in Figure 2 below.
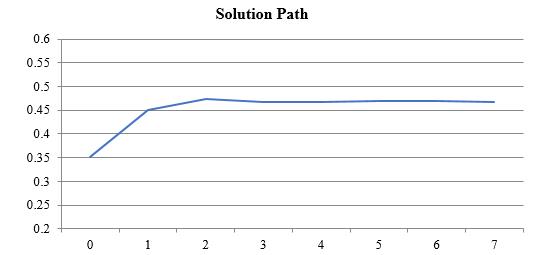
Figure 2 illustrates that after refinements 1 through to 7 the solutions derived from the refinements to the model have followed a clear solution path and the model has reached an optimal state.
Findings
Testing the Refined Model
A pilot study was conducted to test the refined version of the heuristic model and validate the results obtained. Six members of a nonprofit board completed the self administered questionnaire. The data was processed then entered into the heuristic model and individual management deficiency measurements were obtained. The refined management deficiency model produced a detailed analysis of management deficiency for this board across all factors, elements and sub-elements. A summary of the results showing the factor deficiency measurements and the individual deficiency measurements produced by the model are shown in Table 4 below.
The refined model clearly differentiated between the levels of management deficiency of the individual board members. It also produced results that are meaningful and acceptable in terms of their range and absolute value with individual deficiency measurements ranging from 0.282 to 0.603 or 28.2% to 60.3% deficiency. The overall level of board management deficiency was 0.467 or 46.7% which indicates there is room for improvement in this board’s management performance. The model produced a detailed assessment of individual board member strengths and weaknesses across a wide range of factors which could be used to effectively target a management development programme for this board.
Validating the Results
In order to demonstrate that the heuristic model produced an acceptable, approximate solution to the measurement of individual management deficiency, it was necessary to validate the findings from the model by establishing that there was alignment of the model results with an assessment of individual management deficiency obtained by an alternate technique. As this project represented a new field for the application of simulated annealing heuristic methodology there was no established procedure for validating the results. Therefore, a new technique had to be developed to provide a measurement of individual management deficiency by an alternate method. The technique developed was an individual management performance rating technique. The sample used to collect the data required for the model validation was the same six board members used for the pilot test of the model. As nonparametric statistical analysis was applied to the data, a sample size of six was acceptable.
An individual, face-to-face interview was arranged with each board member in the sample after they had completed and returned the questionnaire. Each respondent was asked to rate the overall management performance of the other board members and themselves on an 11 point Likert type scale from 0 to 10 where 0 represents “extremely poor performance in all areas” and 10 represents “extremely good performance in all areas”. For each board member an average management performance rating was calculated from the individual ratings. The average performance ratings were then converted into deficiency ratios by dividing the average performance rating by 10 and subtracting the result from 1. This process is illustrated below:
Rating deficiency ratio = 1 - ( average performance rating ÷ 10 )
For example, if a respondent received an average performance rating of 6.25, their rating deficiency ratio would be given by:
Rating deficiency ratio = 1 - ( 6.25 ÷ 10 )
= 1 – 0.625
= 0.375 or 37.5%
From this process, two sets of results were obtained from the six respondents who made up the sample. Firstly, their responses to the model’s questionnaire produced individual management deficiency ratios as reported in Table 4. Secondly, their responses to the performance ratings produced an alternate measurement of individual management deficiency following the process outlined above. A summary of the model deficiency ratios and the ratings deficiency ratios obtained from the sample is provided in Table 5 below.
To validate the solution produced by the model, the individual deficiency ratios obtained from the model and those obtained from board members’ ratings were subjected to three forms of statistical analysis: the t-test for the significance of the difference between two means, the nonparametric version of the Spearman rank correlation coefficient and the sign test, a nonparametric test for the significance of the difference between two means. The nonparametric analyses were appropriate for these results as the sample size was small and the data is subjective in nature.
At the 95% confidence level the critical region for the t-test was t < -2.447 and t > 2.447. Computations found that t = 0. 415 indicating there was no significant difference between the mean deficiency level produced by the model and the mean rating deficiency level. The Spearman rank correlation coefficient was 0.614 indicating a high level of positive correlation existed between the model deficiency rankings and the rating deficiency rankings. For the sign test, with critical region R <1 corresponding to a 96.8% confidence level, the value of r obtained was 2 which again indicated that there was no significant difference between the mean deficiency level produced by the model and the mean rating deficiency level.
Conclusions
The statistical analysis validated the results obtained from the heuristic model. Therefore, it can be claimed that the heuristic model produced an acceptable, approximate solution to the measurement of management deficiency for this sample. The findings indicate that a model has been developed that can measure individual management deficiency in a nonprofit board across a wide range of factors and, by aggregating those results, produce an assessment of overall management deficiency in a nonprofit board. The model has the potential to become an important, easy to use, diagnostic tool that will identify areas of weakness in a nonprofit management team at the individual team member level which would enable a management development programme to be targeted to improve the performance of the board and, ultimately, the performance of the organisation.
References
Alexander, J. A., Hearld, L. R., & Mittler, J. (2011). Measuring Leadership in Multi-sector Healthcare Alliances. Nonprofit Management and Leadership, 21(4), 341-361.
Allen, N. J., & Meyer, J. P. (1996). The Measurement and Antecedents of Affective, Continuance and Normative Commitment to the Organisation. Journal of Occupational Psychology, 63, 1-18.
Bagnoli, l., & Megali, C. (2011). Measuring Performance in Social Enterprises. Nonprofit and Voluntary Sector Quarterly, 40(1), 149-165.
Balduck, A., Rossem, A. V., & Buelens, M. (2010). Identifying Competencies of Volunteer Board Members of Community Sports Clubs. Nonprofit and Voluntary Sector Quarterly, 39(2), 213-235.
Barnard, H., & Lesirge, R. (2012). Measuring Board Effectiveness. The Guardian, UK, 9th Nov., 2012.
Baruch, Y., & Ramalho, N. (2006). Communalities and Distinctions in the Measurement of Organisational Performance and Effectiveness across For-profit and Nonprofit Sectors. Nonprofit and Voluntary Sector Quarterly, 35(1), 39-65.
Bhardwaj, S., & Vuyyuri, S. (2005). Analysis of Board Effectiveness in Non-profit Organisations in India. Journal of Social Science, 10(1), 29-36.
Brown, W. A. (2005). Exploring the Association between Board and Organisational Performance in Nonprofit Organisations. Nonprofit Management and Leadership, 15(3), 317-339.
Brown, W. A. (2007). Board Development Practices and Competent Board Members: Implications for Performance. Nonprofit Management and Leadership, 17(3), 301-317.
Brown, W. A., & Iverson, J. D. (2004). Exploring Strategy and Board Structure in Nonprofit Organisations. Nonprofit and Voluntary Sector Quarterly, 33(3), 377-400.
Cornforth, C. (2001). What Makes Boards Effective? An Examination of the Relationships between Board Inputs, Structures, Processes and Effectiveness in Non-profit Organisations. Corporate Governance: an International Review, 9(3), 217-227.
Cornforth, C. (2012). Non-profit Governance Research: Limitations of the Focus on Boards and Suggestions for New Directions. Nonprofit and Voluntary Sector Quarterly, 41(6), 1116 -1135.
Dawande, M., Gavirneni, S., & Tayur, S. (2006). Effective Heuristics for Multiproduct Partial Shipment Models. Operations Research, 54, 337-352.
Doherty, A., & Hoye, R. (2011). Role Ambiguity and Volunteer Board Member Performance in Nonprofit Sports Organisations. Nonprofit Management and Leadership, 22(1), 107-128.
Epstein, M. J., & McFarlan, F. W. (2011). Measuring the Efficiency and Effectiveness of Nonprofits’ Performance. Strategic Finance, October, 2011, 27-34.
Forbes, D. P. (1998). Measuring the Unmeasurable: Empirical Studies of Nonprofit Organisational Effectiveness from 1977 to 1997. Nonprofit and Voluntary Sector Quarterly, 27(2), 183-202.
Gilli, M. and Schumann, E. (2012). Heuristic Optimisation in Financial Modelling. Annals of Operations Research, 193, 129-159.
Glisky, E. L. (2007). Changes in Cognitive Functions in Human Aging. Brain Aging Models, Methods and Mechanisms. Riddle, D. R. Editor.
Greatbanks, R., Elkin, G., & Manville, G. (2010). The Use and Efficacy of Anecdotal Performance Reporting in the Third Sector. International Journal of Productivity and Performance Management, 59(6), 571-585.
Green, J. C., & Griesinger, D. W. (1996). Board Performance and Organisational Effectiveness in Nonprofit Social Service Organisations. Nonprofit Management and Leadership, 6(4), 381-402.
Harrison, J., &Sexton, c. (2004). The Paradox of the Not-for-profit Hospital. Health Care Manager, 23(3), 192-204.
Heiberg, D., & Bruno-van Vijfeijken, T. (2009). Which Measurement Matters. Monday Developments, 27(9), 26-27.
Herman, R. D. (1990). Methodological Issues in Studying the Effectiveness of Nongovernmental and Nonprofit Organisations. Nonprofit and Voluntary Sector Quarterly, 19(3), 293-306.
Herman, R. D., & Renz, D. O. (1997). Multiple Constituencies and the Social Construction of Nonprofit Organisation Effectiveness. Nonprofit and Voluntary Sector Quarterly, 26, 185-206.
Herman, R. D., & Renz, D. O. (2002). Nonprofit Organisational Effectiveness: Practical Implications of Research on an Elusive Concept. Issued by the Midwest Centre for Nonprofit Leadership, University of Missouri-Kansas City.
Holland, T. P., Chait, R. P., & Taylor, B. E. (1989). Board Effectiveness: Identifying and Measuring Trustee Competencies. Research in Higher Education, 30(4), 435-453.
Jackson, D. K., & Holland, T. P. (1998). Measuring the Effectiveness of Nonprofit Boards. Nonprofit and Voluntary Sector Quarterly, 27(2), 159-182.
Kirkpatrick, S., Gelatt, C. D., & Vecchi, M. P. (1983). Optimisation by Simulated Annealing. Science, 220(4598), 671-680
Langabeer, J. R., & Galeener, C. A. (2007). Measuring Board Activity in Governance of Not-for-profit Healthcare. Texas Public Health Association Journal, 60(1), 22-25.
Lee, D., & Brower, R. S. (2006). Pushing the Envelope on Organisational Effectiveness: Combining an Old Framework and a Sharp Tool. Public Performance and Management Review, 30(2), 155-178.
McColl, E., Jecoby, A., Thomas, L., Soutter, J., Bamford, C., Steen, N., Thomas, R., Harvey, E., Garratt, A., & Bond, J. (2001). Design and Use of Questionnaires: A Review of Best Practice Applicable to Surveys of Health Service Staff and Patients. Health Technology Assessment, 5(31).
McDonagh, K. J. (2006). Hospital Governing Boards: A Study of Their Effectiveness in Relation to Organisational Performance. Journal of Healthcare Management, 51(6), 377-389.
Moxham, C. (2010). Help or Hindrance? Examining the Role of Performance Measurement in UK Nonprofit Organisations. Public Performance & Management Review, 33(3), 342-354.
Mwenja, D. and Lewis, A. (2009). Exploring the Impact of the Board of Directors on the Performance of Not-for-profit Organisations. Business Strategy Series, 10(6), 359-365.
Nafukho, F. M. (2009). HRD’s Role in Identifying, Measuring and Managing Knowledge Assets in the Intangible Economy. Advances in Developing Human Resources, 11(3), 399-410.
Nicholson, G., Newton, C., & McGregor-Lowndes, M. (2012). The Nonprofit Board as a Team. Non-profit Management and Leadership, 22(4), 461-481.
Nooriafshar, M., & Vibert, C. (2012). Perceptions of Success in a Nascent Wine Industry. Paper 10, Regional Development Conference, University of Southern Queensland, Australian Centre for Business Sustainability and Development.
Ostrower, F., & Stone, M. M. (2010). Moving Governance Research Forward: A Contingency-Based Framework and Data Application. Nonprofit and Voluntary Sector Quarterly, 39(5), 901-924.
Parker, L. D. (2007). Internal Governance in the Nonprofit Boardroom: A Participant Observer Study. Corporate Governance, 15(5), 923-934.
Paulhus, D. L. (1991). Measurement and Control of Response Bias. Measures of Personality and Social Psychological Attitudes, San Diego, CA: Academic Press, Inc. 17-59.
Peer, E. and Gambiel, E. (2011). Too Reliable to Believe? Response Bias as a Potential Source of Inflation in Paper-and-Pencil Questionnaires Reliability. Practical Assessment, Research and Evaluation. 16(9).
Preston, J. B., & Brown, W. A. (2004). Commitment and Performance of Nonprofit Board Members. Nonprofit Management and Leadership, 15(2), 221-238.
Productivity Commission. (2010). Contribution of the Not-for-Profit Sector, Research Report. Canberra.
Rogelberg, S. G., & Stanton, J. M. (2007). Understanding and Dealing with Organisational Survey Non-Response. Organisational Research Methods, 10(2), 195-209.
Satoglu, S. I., Durmusoglu, M. B. and Ertay, T. (2010). A Mathematical Model and a Heuristic Approach for Design of the Hybrid Manufacturing Systems to Facilitate One-piece Flow. International Journal of Production Research, 48(17), 5195-5220.
Sawhill, J. C., & Williamson, D. (2001). Mission Impossible? Measuring Success in Nonprofit Organisations. Nonprofit Management and Leadership, 11(3), 371-386.
Schjoedt, L., & Kraus, S. (2009). Entrepreneurial Teams: Definition and Performance Factors. Management Research News, 32(6), 513-524.
Taysir, E. A., & Taysir, N. K. (2012). Measuring Effectiveness in Nonprofit Organisations: An Integration Effort. Journal of Transnational Management, 17, 220-235.
Templemeier, H., & Buschkuhl, L. (2009). A Heuristic for Dynamic Multi-level Capacitated Lotsizing Problem with Linked Lotsizes for General Product Structures. Operations Research Spectrum, 31, 385-404.
Thach, E., & Thompson, K. J. (2007). Trading Places: Examining Leadership Competencies between For-profit Vs Public and Non-profit Leaders. Leadership and Organisational Development Journal, 28(4), 356-375.
Tucker, B. P. (2010). Through Which Lens? Contingency and Institutional Approaches to Conceptualising Organisational Performance in the Not-for-profit Sector. Journal of Applied Management Accounting Research, 8(1), 17-33.
Tucker, B. P., & Parker, L. D. (2013). Out of Control? Strategy in the Not-for-profit Sector: The Implications for Management Control. Accounting, Auditing & Accountability Journal, 26(2), 234-266.
Villar, A. (2008). Response Bias. In Encyclopaedia of Survey Research Methods. Laurakas, P. J. (Ed)
Widmer, C. (1993). Role Conflict, Role Ambiguity and Role Overload on Boards of Directors of Nonprofit Human Service Organisations. Nonprofit and Voluntary Sector Quarterly, 22(4), 339-356.
Willems, J., Huybrechts, G., Jegers, M., Weijters, B. Vantibborgh, T. Didee, J., & Pepermans, R. (2012). Non-profit Governance Quality: Concept and Measurement. Journal of Social Science Research, 38(4), 561-578.
Copyright information

This work is licensed under a Creative Commons Attribution-NonCommercial-NoDerivatives 4.0 International License.