

Customer Segmentation With Machine Learning for Online Retail Industry

Abstract
In this study, a comparative analysis of various techniques is presented on customer segmentation methods based on online retail data. A few unsupervised machine learning (ML) clustering models such as K-means clustering model, hierarchical clustering model, Density-based Spatial Clustering of Applications with Noise (DBSCAN) model and a traditional model based on recency, frequency and monetary (RFM) clustering are evaluated in terms of the insight each model offers. The traditional model is included in the analysis since clustering models are not optimization models and the goodness of unsupervised models could only be evaluated with a practical business approach. The results are shared, and each model is assessed in terms of usability for marketing and communication strategies. At the end, the strengths and weaknesses of each model are discussed, and a methodology is proposed for selecting the best clustering method when facing the customer segmentation problem. A detailed literature review is also presented covering the developments in the field of artificial intelligence, clustering models in ML and examples of customer segmentation implementations in various industries.
Keywords: Customer segmentation, machine learning, k-means clustering, hierarchical clustering, DBSCAN clustering
Introduction
This article aims to bring a new approach to solve the old customer segmentation problem. Customer segmentation is the basis to understand purchase behavior which is essential in pricing and demand forecasting decisions of any business. Today a lot of effort is spent to understand customer segments to be able to serve them in the best possible way considering product portfolio, pricing, marketing, communication and customer experience.
In this study, a comparative analysis of various techniques is presented on customer segmentation methods based on online retail data. A few Machine Learning (ML) clustering models and a traditional model (Recency, Frequency and Monetary) are evaluated in terms of the insight each model offers. At the end, the strengths and weaknesses of each model is discussed and a methodology is proposed for selecting the best clustering method when facing the customer segmentation problem.
The remainder of this paper is organized as follows. In Section 2, a detailed literature review is provided on artificial intelligence (AI), clustering models and customer segmentation problems in various industries. Section 3 describes the data, the models and the accompanying exploratory data analysis. In Section 4, the conclusion is summarized together with results of each model and short discussion on future work.
Literature Review
A detailed literature review in three fields namely; AI, clustering models and customer segmentation is presented in this section. One of the biggest challenges for the business world nowadays is the speed of decision making. Recent developments in computer science and data processing technologies enable companies to act faster, equipped with bigger data than before. At the same time customers are more demanding than ever equipped with more knowledge about available products and services. Decisions need to be more data driven to be able to survive in the market. Fotaki et al. (2014) state that new techniques are required for managing and analyzing the huge amount of data, and this is where the concept of Big Data can play an essential role. Hackenberger (2019) discusses 9 V’s of data including 3 key features of volume, velocity, and variety which differentiates normal data from big data.
Historical timelines of research in the field of Artificial Intelligence (AI) describe a sixty-year journey. A few of the significant events, policies, and breakthroughs in the field of AI are shown in Figure 1 below (Tobin et al., 2019). In terms of technological advances, research in neural networks started winning vision and speech competitions in 2005 and was a dominant subfield of research by 2009.
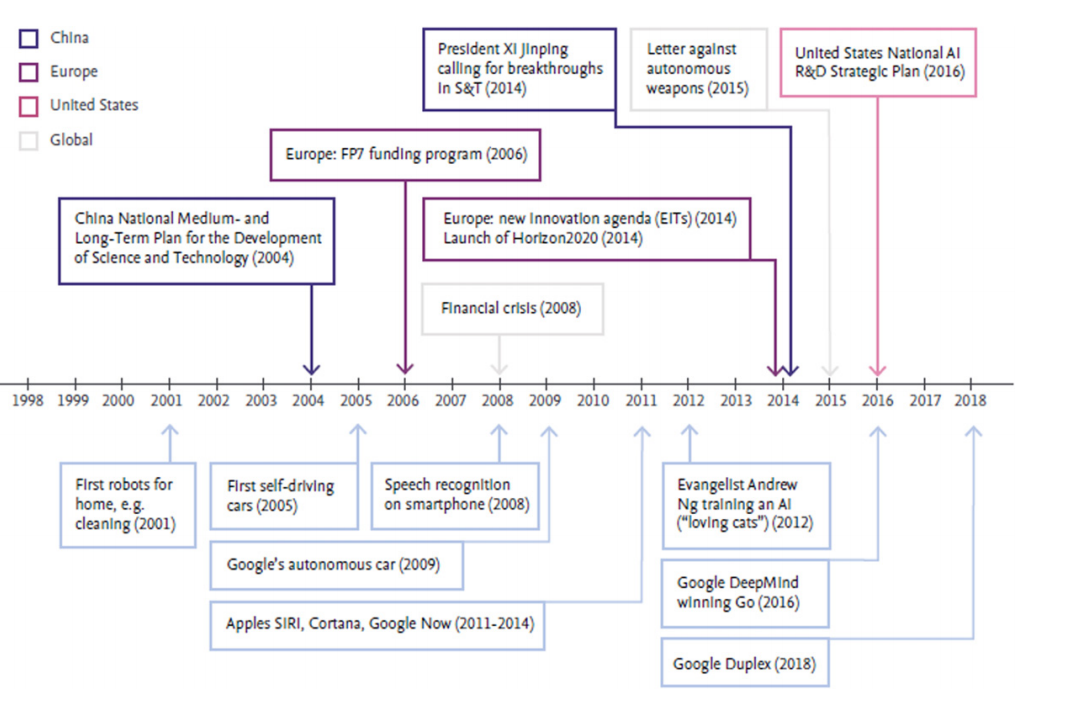
Recent national and regional policies reflect the importance of competitiveness in the field with calls for large investments, as well as the need to address the tremendous change that AI will bring to human society and the ethical implications (Tobin et al., 2019).
The decreased cost of computing power paired with increased availability of large data sets for training machines caused a high growth rate in AI publications according to Scopus, an abstract and citation database (Siebert et al, 2018). They claim the AI research field generates approximately sixty thousand publications per year. Globally, the field of AI has shown strong growth of 12.9% per year in the last five years (1998-2017). And this growth is higher than the growth seen across all research, which has grown at a rate of 2.3% per year in the same period.
Practitioners characterize AI based on four capabilities: perception, comprehension, acting and learning (Bawack et al., 2021). A system’s ability to perceive its environment, understand its intention and context, take appropriate action and learn from experience. Therefore, systems that can make predictions, recommendations and interact with humans based on these four capabilities are what is called AI today as seen in Figure 2.
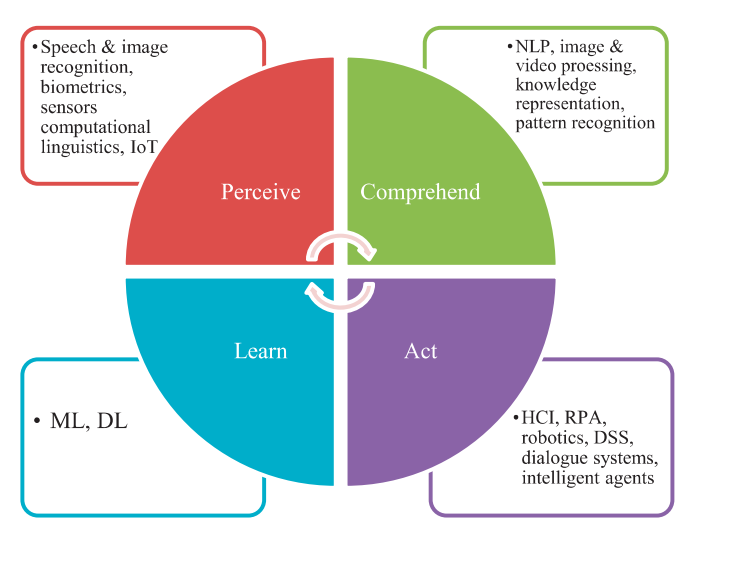
Information systems have mostly adopted AI as an ability perspective of AI. Most studies focus on using AI as a tool for learning; using machine learning and deep learning algorithms, combined with NLP for understanding capabilities. It is used for forecasting, prediction, and optimization by many industries.
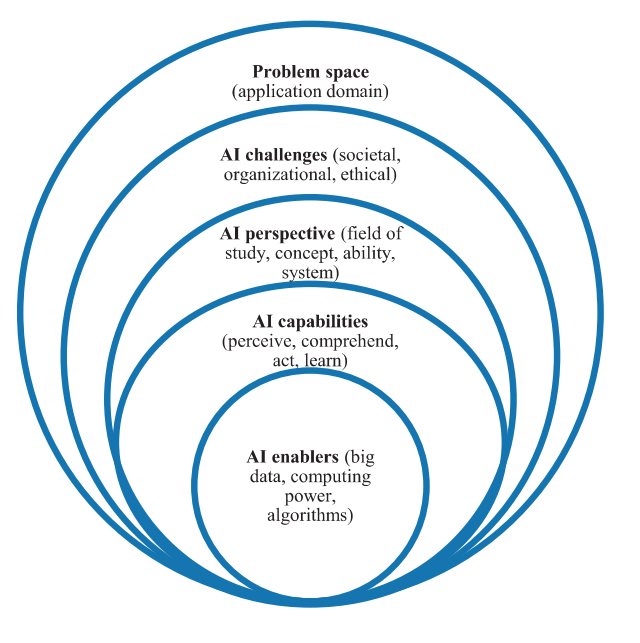
A framework for future research directions is suggested by Bawack et al. (2021) as in Figure 3:
Bawack et al. (2021) list wide collection of AI applications and emerging research areas in health care, education, food, internet services, retailing, marketing, sales and advertising, industrial services and manufacturing, financial services, IT services and telecommunications, transportation and logistics, automotive retailing and services, hotels, travel, restaurants and leisure, aerospace and defense, media, mass communication and entertainment, energy and utilities, public services and society with all the applications and emerging research areas and also with topics of interest per industry.
Borges et al. (2021) focuses on issues involved in practical use and lack of knowledge as regards using AI in a strategic way in order to create business value. They present a conceptual framework according to four sources of value creation: decision support, customer and employee engagement, automation, new products and services. The map between AI tools and business strategy is given in Figure 4.
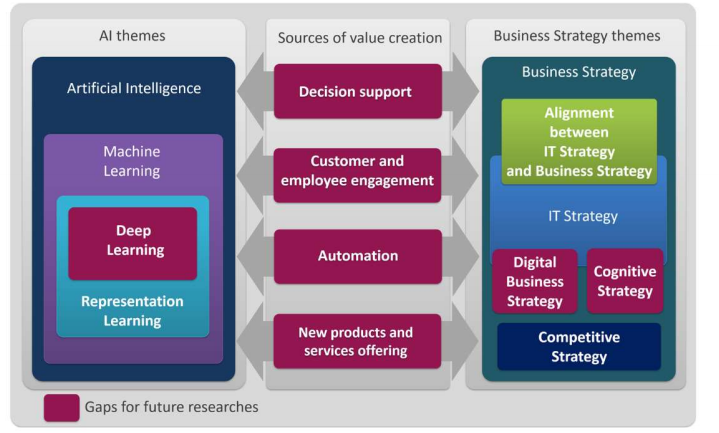
They claim this map is relevant to both theoretical and managerial perspectives with opportunities for generating novel theory and new forms of management practices. Strategic use of AI technologies has not been well explored according to this study (Borges et al., 2021).
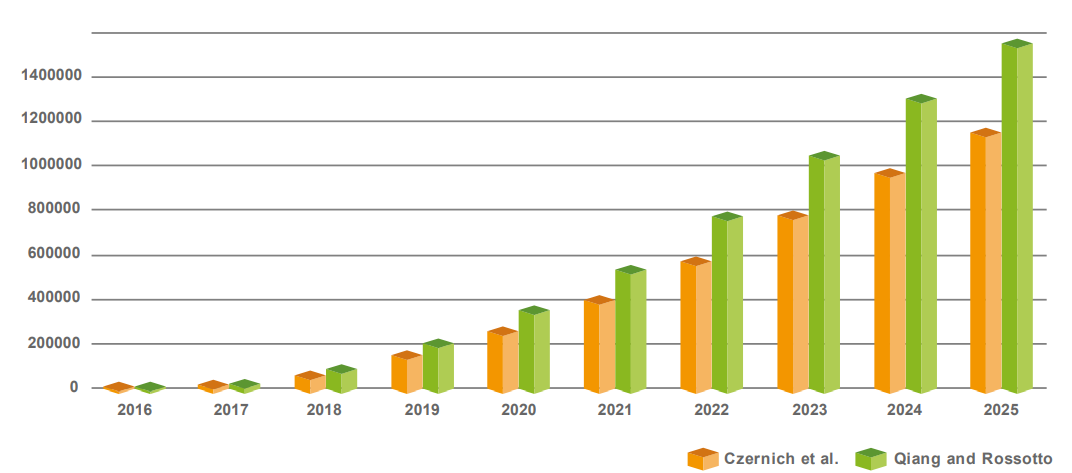
Another valuable overview is presented by Mustapha et al. (2020). Their discussion is mostly on components of AI which are listed as expert systems, heuristic problem solving, natural language processing and vision. They analyze the financial impact of AI as well. It is claimed that the revenues of the AI market worldwide were around 260 billion US dollars in 2016 and this is estimated to exceed $3,060 billion by 2024. This has had a direct effect on robotic applications, including exoskeletons, rehabilitation, surgical robots and personal care-bots. The economic impact of the next 10 years is estimated to be between $1.49 and $2.95 trillion. These estimates are based on benchmarks that take into account similar technological achievements such as broadband, mobile phones and industrial robots. Figure 5 shows the predicted economic effect of AI worldwide, estimated based on GDP.
According to Mustapha et al. (2020), AI has had no great effect directly on common people's life until now, and it is still limited to some areas like military, space, industry, medical, neutral networks and geology. However, with the extensive research and advancement in the field of AI by the end of 2035, it is expected that, we will be able to move away from today’s machinery that necessarily come with weighty manuals regarding machine languages, and of course, develop the machinery, which will be able to understand human completely. Hence, we would also have robots as doctors in hospitals, professors in classrooms, drivers in buses. Consequently, that would be the era of transhumanism where human beings and machines merge into cyborgs or cybernetic organisms that are more capable and powerful than either.
Since this study has used clustering as a method, let’s focus on these algorithms a little bit in detail. Clustering is one of the important data mining issues, especially for big data analysis, where large volume data should be grouped. Big data is the term for a collection of data sets so large and complex that it becomes difficult to process using traditional data processing tools. Big data can be characterized by three V's: volume (large amounts of data), variety (includes different types of data), and velocity (constantly accumulating new data). Big data is not just about lots of data, it is actually a new concept providing an opportunity to find a new insight into the existing data.
Clustering is dividing the subject of interest into a number of groups so that there are more similarities in the same group versus the subjects in other groups. Often a measure of distance is used to compute that similarity. Madhulatha (2012) identifies 5 clustering methods:
- Hierarchical algorithms find successive clusters using previously established clusters. It can be agglomerative (bottom-up) or divisive (top-down). Agglomerative algorithms begin with each element as a separate cluster and merge them in successively larger clusters. Divisive algorithms begin with the whole set and proceed to divide it into successively smaller clusters.
- Partitioning algorithms are based on specifying an initial number of groups, and iteratively reallocating objects among groups to convergence. This algorithm typically determines all clusters at once. Most applications adopt one of two popular heuristic methods like k-means algorithm and k-medoids algorithm.
- Density-based clustering algorithms are devised to discover arbitrary-shaped clusters. In this approach, a cluster is regarded as a region in which the density of data objects exceeds a threshold. DBSCAN and SSN are two typical algorithms of this kind.
- The grid based clustering approach uses a multiresolution grid data structure. It quantized the space into a finite number of cells that form a grid structure on which all the operations for clustering are performed. Grid approach includes STING (STatistical INformation Grid) approach and CLIQUE
- Model-Based Clustering methods attempt to optimize the fit between the given data and some mathematical model. Such methods are often based on the assumption that the data are generated by a mixture of underlying probability distributions. Model-Based Clustering methods follow two major approaches: the Statistical Approach or Neural network approach. (pp. 719-723)
Clustering is not an optimization problem, which makes the solution comparable and the results descriptive and difficult to generalize. The best solution depends on the user’s choices and assumptions about the problem. So, expertise in the domain area is necessary to evaluate different solutions. Stability of results and robustness of the suggested clusters can be considered as performance parameters.
There is another interesting study from Gelbard et al. (2007). They compare clustering methods with their underlying assumptions over four known datasets. They claim the unpredictability of various methods as it is difficult to evaluate validity of the relevant assumptions. They claim the performance of clusters is algorithm dependent and rank the algorithms as in Table 1 based on matching scores.
Clustering use is expected to gain wide use in commerce in the near future but the adoption rate is slow due to non-standardization in the methods, unpredictability, the difficulty in evaluation and usability of clusters by the business world (Erlich et al., 2016).
Although it is mentioned that using AI in a business context is very limited and based on the technology potential of certain few big companies rather than a business need itself, marketing is a relatively well explored area where AI is used. In the marketing area, the first article to be mentioned is a review described as a trajectory of marketing and AI research fields (Vlacic et al., 2021). They reviewed 164 articles published in Web of Science and Scopus indexed journals (between 1987 and 2020 but mostly recent - after 2017 onwards) and developed a context-specific research agenda built upon those articles. Their analysis is based on: adoption, use, acceptance of AI technology in marketing, role of data protection and ethics, role of institutional support for marketing AI, revolution of labor market and marketers’ competencies perspectives. They portray the research domain along with its dimension poles as in Figure 6 using information of 21 descriptors in two dimensions using content analysis combined with Homals statistical technique. Proportion of variance explained by each pole accounts for 22.21% of the variance.
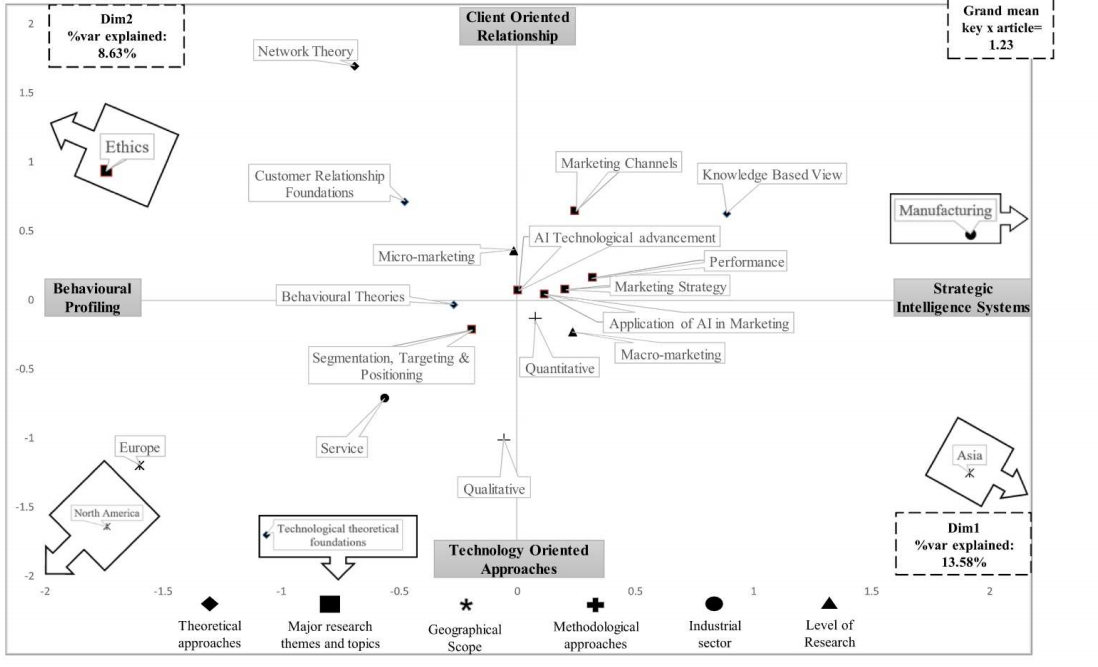
They point out the potential research gaps and future research opportunities based on the distances between the descriptors given in this map. The greater the distance, the lesser their association and it presents more opportunities to be explored. They also did a very good analysis on so-called foundations which are: Behavioral theories, customer relationship management, knowledge-based view and network theory. This study is different from previous studies on the relationship between AI and marketing since previous reviews are expert-based reviews and this one offers a more objective account of the development of AI and marketing and citation analysis. They also propose future research themes linked to adoption and use of AI, acceptance of AI technology, revolution of the labor market and marketers’ competences, role of institutional support, importance of data protection and ethics, recent COVID-19 outbreak which poses additional technological and behavioral challenges. They present an interesting overview based on the use of AI in; strategy and planning, product management, pricing management, place management, and promotion management, covering 4 p’s of marketing: product, price, place, promotion.
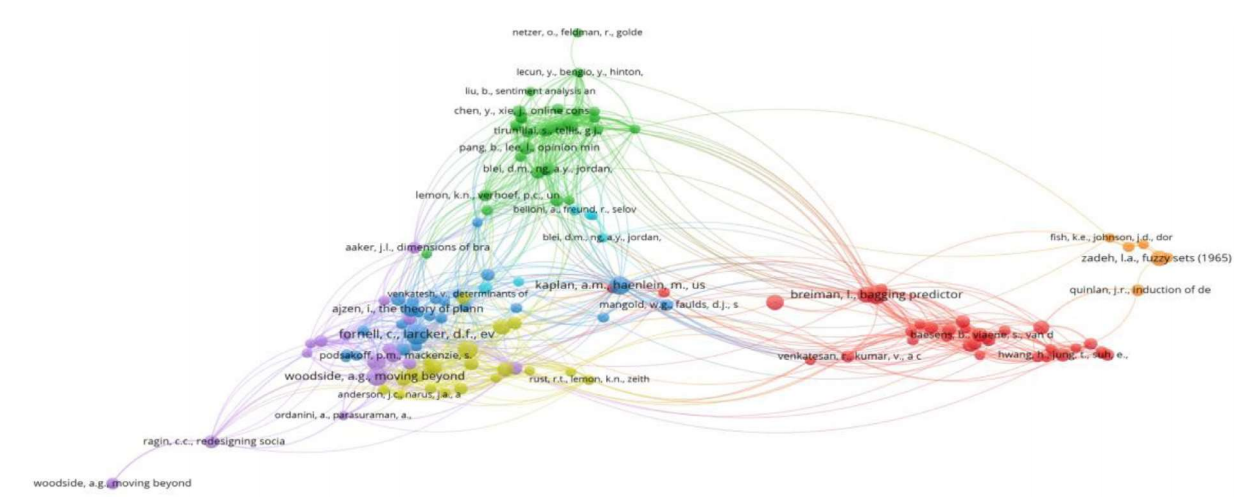
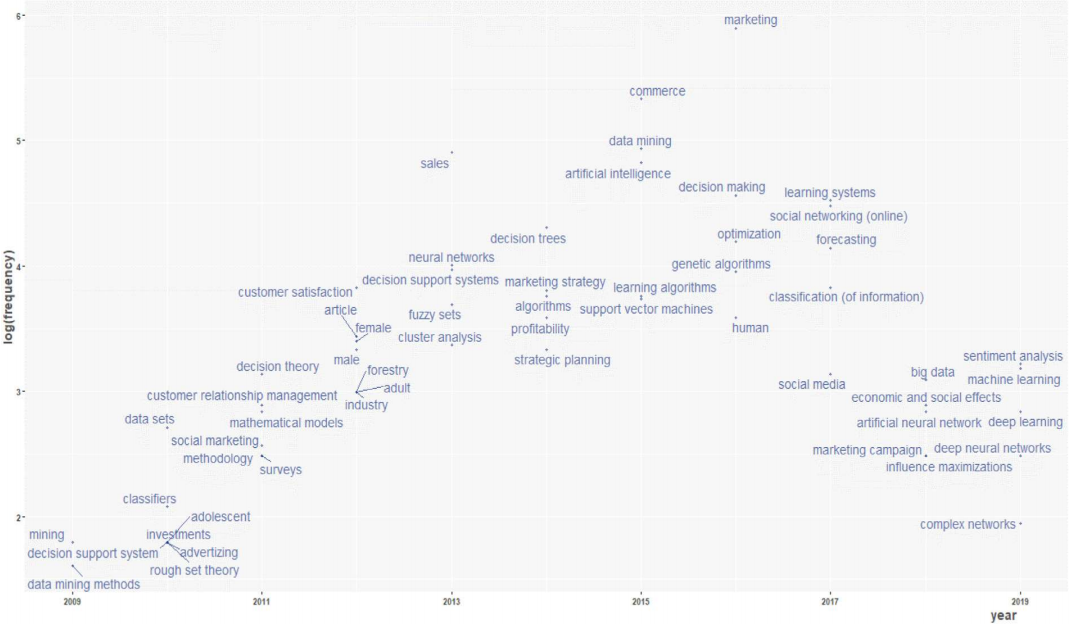
Another interesting analysis reviews the studies on AI and marketing focusing on customer experience and the 4th industrial revolution (Jung, in press). They provide a holistic view of using AI to enhance customer experience. They also attempt to aggregate the research studies about AI in marketing using bibliometric analysis and co-citation analysis. Based on their research, the co-citation and trend topic analysis are given in Figure 7 and Figure 8 respectively.
There is a case study by Qian et al. where electronic toll collection (ETC) customer segmentation is constructed based on a decision tree approach. Accordingly, empirical results indicate that the decision tree method is better able to analyze travel characteristics, present values and appreciation potentials for ETC customer classification (Qian et al., 2018). Another recent customer segmentation implementation studies a two-stage clustering neural-network-based Kohonen self-organizing maps for investment of retail banking customers (Kovács et al., 2021). They claim to identify clusters of potential customers with similar preferences and gain insights into their investment patterns. Another research is in the field of unsupervised clustering algorithms implemented in the energy sector (Bogensperger & Fabel, 2021). Sun et al. (2021) develop a heuristic clustering method for customer segmentation, termed Gaussian Peak Heuristic Clustering (GPHC) dealing with customer requirement data. They present a practical case to illustrate the effectiveness of GPHC in solving the customer segmentation problem.
Finally, there are a few literature reviews to mention. Ahmad and Khan (2019) present a taxonomy for the study of data clustering algorithms divided into five major research themes as partitional, hierarchical, model-based, neural network based, and others. Another review by Kaur and Kaur (2017) focuses on data mining techniques on customer segmentation, covering both clustering and subgroup discovery together with selected related work.
AI in Practice
Data and Model
This paper is an investigation of online retail shopping data and what can be driven out of the data to gain insights about customers which can be used in potential marketing and sales activities. As a result of this work, it is found out that artificial intelligence (AI) can help to utilize limited resources in a most effective way when targeting customers. Effective customer segmentation brings the benefits such as effective marketing activities, correct promotion decisions, identifying the trends for better customer experience and delivery of relevant products.
Shopping data used in this study is publicly available and the approach could be used for any retail shopping context. Let’s first identify the data, model and loss which are the main components of machine learning. Trial and error method in terms of model selection and normalization of data is used in this study to cluster the customers.
Customers are grouped into clusters so that they can be identified as loyal customers, random infrequent shoppers, customers with potential to become loyal customers, big spenders, small spenders etc. There is no labeled data in this problem but based on the spending of customers, how often they shop and when is the last time that they have shopped some conclusions are drawn to decide the marketing and sales strategies. For example, ease of communication is important for loyalty tier customers and it is assumed that they have the need of recognition for their loyalty. Another strategy is to decide the shipping policy based on customer clusters. For example, if the customer is from the top tier of loyal customer clusters, they get free shipment. If they are from low or mid-tier, they will pay or they will benefit from free shipment depending on the shopping case. If a customer is identified as potentially loyal, they will receive retaining benefits such as special discounts based on volumes or bundled products designed for increasing sales purposes. Depending on the label, if the customer is a rare and small spender, it is advised not to invest time, money and energy for these customers from a business perspective. These cluster labels could be used in communication, promotions, shipment policy, special vouchers, and discounts as marketing strategies.
There are 541909 data points with 8 features. The data is publicly open and known as online retail data (Chen et al. 2012). Each data point corresponds to one transaction with the details of invoice number, date, product with its stock codes, quantity, price and customer identifier and country of residence of customers. InvoiceNo is the Invoice number, uniquely assigned to each transaction.
StockCode is the product code, uniquely assigned to each distinct product.
Description is the name of the product.
Quantity is the quantity of each product purchased per transaction.
InvoiceDate is Invoice date and time together, the day and time showing when each transaction happens.
UnitPrice is the product price per unit in Euros.
CustomerID, a 5-digit number uniquely assigned to each customer.
Country is the name of the country where each customer resides. Labels are cluster numbers per customer. From these 541909 shopping transactions 4338 customers are identified.
Various clustering techniques are tested in this study. They are all unsupervised machine learning algorithms such as kmeans (partitioning algorithm), hierarchical clustering (hierarchical algorithm- agglomerative approach or bottom up approach from leaves to the root), Density-based Spatial Clustering of Applications with Noise (DBSCAN- density based algorithm). Each algorithm has its own advantages and disadvantages. Another clustering based on a business perspective is produced which has nothing to do with AI but to be compared with the clusters produced by AI algorithms. The details of the findings from each model are presented in Sections 3 and 4 of this article.
First Exploratory Data Analysis is done to visualize, summarize and interpret the information that is hidden in data. In the second part, insights are drawn, data features are used for unsupervised machine learning modeling to cluster the customers. In the final part, the outputs of several models are discussed and clusters are compared to choose the best fitting model from the business point of view.
Exploratory Data Analysis (EDA)
Missing data is analyzed, and it is decided that null CustomerID rows should be removed from the set since we try to get insights about customers. If we cannot identify who each customer is, there is no point of using that data as input data.
New columns are added using the original dataset which could be helpful for further data analysis: revenue, days, dp, month, year, dow. Revenue is obtained by multiplying Quantity and UnitPrice. For any retail company revenue figures are important to draw conclusions about customer clusters. Days show how many days after the first (min) InvoiceDate the purchase is done. Dp stands for days prior and shows how many days before the last available transaction date the purchase is done. These values are then used to calculate the frequency of purchases and how recently the last transaction happened based on each customer in the data set. Month, year and dow i.e., day of week are all derived from the invoice date.
Revenue per country, product, month and day of week are checked. One day of the week is missing from the dataset. Box plots and correlation matrices are used to identify the outliers in the dataset. Revenue and quantity have high correlation (0.886) and revenue is chosen as a more significant measure from a business point of view. Negative quantities and prices are removed as they do not make any sense. Some duplicated rows are identified and removed. Sub datasets are defined per customer based on total revenue, frequency of shopping and recency of the last transaction and these datasets are joined (merged) in a new customer data set initially called dfc.
Unsupervised Machine Learning
K Means Clustering
First clustering method tested in scope of this study is the k means clustering. K-means determines k centroids in the data and clusters points by assigning them to the nearest centroid.
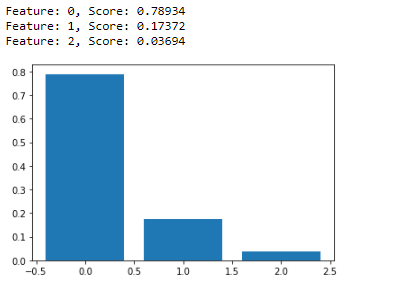
Random forest classifier is used to identify significant features of the customer dataset as shown in Figure 9. As a result, days prior feature with the lowest significance score (0.03694) is removed for some portions of the analysis.
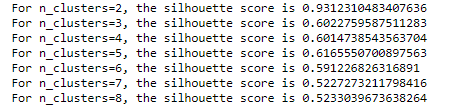
Subsets are created for a given cluster number from 3 to 8. Elbow curve is drawn (see Figure 10), and Silhouette scores are calculated (see Figure 11) to have a hint on the best number of clusters as seen below. A Silhouette score of 1 means that the clusters are very dense and nicely separated. The score of 0 means that clusters are overlapping. The score of less than 0 means that data belonging to clusters may be wrong/incorrect.
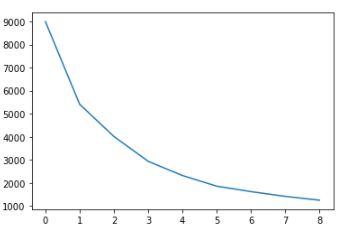
So, a breakpoint can be seen at n=3 and a lighter break at n=5 in the elbow curve.
When silhouette scores are checked, 2 clusters have the highest score but from a business point of view, it is desired to differentiate customers into more clusters if possible. The score increases compared to 4 clusters when we have 5 clusters. This gives a hint that 5 clusters might be a good idea. Again, similar to the elbow curve result, 4 clusters look worse than both 3 clusters and 5 clusters. So, both elbow curve and silhouette scores suggest that we should either have 3 or 5 clusters at the end.
The clusters are compared by their plots in the figure below (see figure 12).
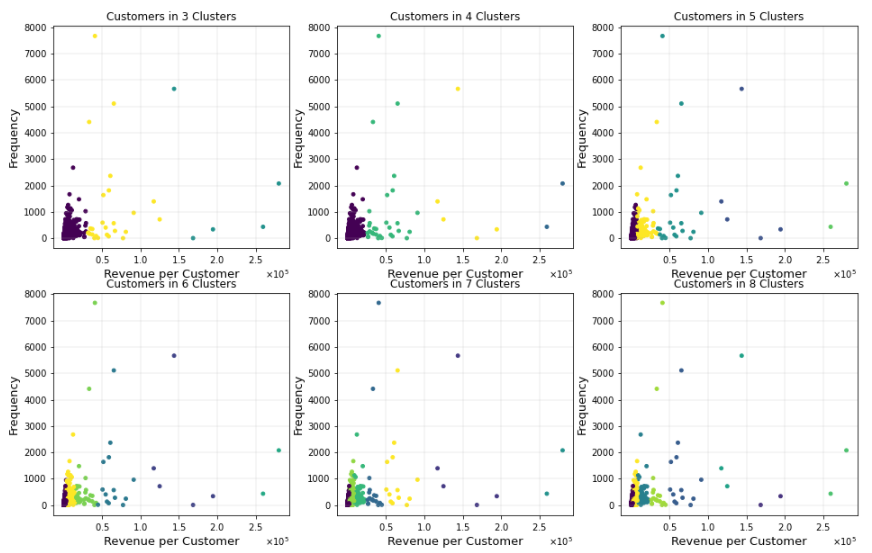
As seen in these plots, categorizing customers based on revenues makes sense from a business point of view and it is better to differentiate customers spending 15000 euros than 25000 euros annually. The 5-cluster approach again looks better in terms of differentiating enough based on revenues coming from the customers.
Number of customers in the model with 5 clusters are shown below (see Figure 13):
Since the total number of customers in the highest revenue cluster are very small, we can think about joining cluster 1 and cluster 4 to have a strategy for these 7 corporate type accounts. This is considered as a future work extension.
We see cluster 1 and cluster 4 customers as the highest annual spending customers with high frequency and very recent purchases. They are very few in numbers. Basically 14% of total revenue is coming from these 7 customers out of 4338 customers. Cluster 2 represents the next higher spending loyal customers both active and with recent purchases. Cluster 3 is the third highest spending customers with moderately active and moderately recent transactions. Cluster 0 represents the lowest value customers bringing the lowest revenues, inactive with very rare random purchases. They are the highest in customer numbers yet do not require any special attention in terms of marketing and sales.
Cluster 1 and cluster 4 customers, in other terms those 7 accounts could be rewarded with surprises as they are our top tier customers and should be taken care of individually. The marketing focus should be on cluster 2 to take care of the loyal base and then cluster 3 who are potential loyal customers and should be followed closely. In conclusion of the resulting clusters, one can confirm that outliers existing in the dataset might cause some issues in the clustering. These outliers are not removed from the dataset, intentionally, since these extreme behaviors are important for marketer to identify and target. If there are a handful of very big spenders in the data, certainly they should not be removed from the radar of marketers. While k-means is easy to understand and implement in practice, the algorithm is known to have no notion of outliers, so all points are assigned to a cluster even if they do not belong in any. In the domain of anomaly detection, this causes problems as anomalous points will be assigned to the same cluster as “normal” data points. The anomalous points pull the cluster centroid towards them, making it harder to classify them as anomalous points. This is the biggest weakness of k-means clustering.
Hierarchical Clustering
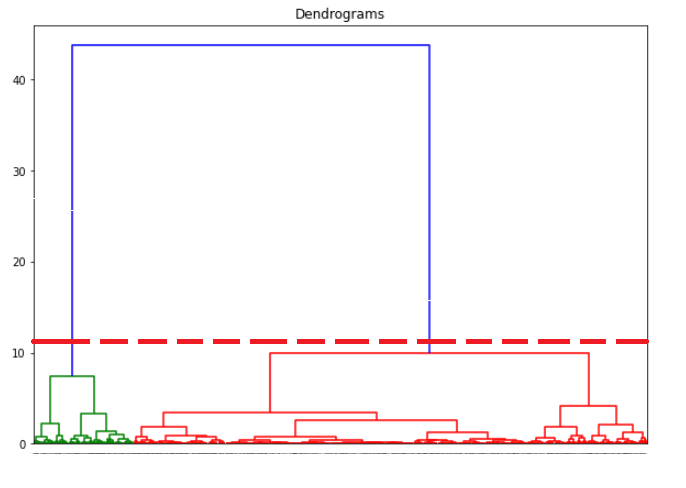
Since k-means clustering is not an obvious or optimal solution, another method is tested against this dataset. As covered in the literature review section of this paper, clustering methods are more about the datasets and algorithms used than the domain knowledge and usually present unpredictable results on clusters. The advantage of hierarchical clustering not having to pre-define the number of clusters gives it quite an edge over k-means clustering. Here an agglomerative clustering algorithm is used and the relevant dendrogram is found as in Figure 14.
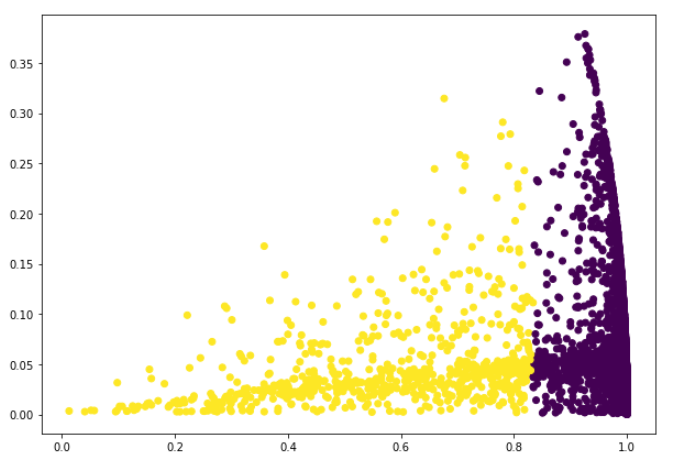
As suggested by this dendrogram, 2 clusters (green and red) are cut by the dashed red line and created. The data points are shown as below (see figure 15) based on this hierarchical clustering method:
Although the method clearly suggests 2 clusters only, 5 clusters are forced using hierarchical clustering method and the result is seen in Figure 16.
When the result of this clustering method is evaluated from a business point of view, one must say that it is not intuitive or helpful in defining various marketing strategies for online retailers. 2 groups of customers do not have enough variation and differentiation to segment the products, price, place, and promotion decisions based on the customer clusters. So, although we cannot validate the model from an optimization point of view, it can be said that the model fails from a business point of view.
DBSCAN Clustering
Since the previous two methods are not clear winners of the problem analyzed in this study, one more AI clustering algorithm has been decided to be tested against the online retail shopping data.
DBSCAN (Density-Based Spatial Clustering of Applications with Noise) is the most well-known density-based clustering algorithm, first introduced in 1996 by Ester et al. (1996). Due to its importance in both theory and applications, this algorithm is one of three algorithms awarded the Test of Time Award at the KDD conference in 2014 (SIGKDD, 2021).
They point out the advantages of DBSCAN as the minimal requirements of domain knowledge to determine the input parameters, good chances of discovery of clusters with arbitrary shape and good efficiency on large databases. It is claimed that the well-known clustering algorithms offer no solution to the combination of these requirements. They present a new clustering algorithm DBSCAN relying on a density-based notion of clusters which is designed to discover clusters of arbitrary shape.
Since in our problem, there are many outliers and noise in terms of data standards, but not from a business perspective, and the density of current clusters vary a lot in terms of data points per cluster; DBSCAN is considered to be a good choice of method to be tested against the online shopping data in this study.
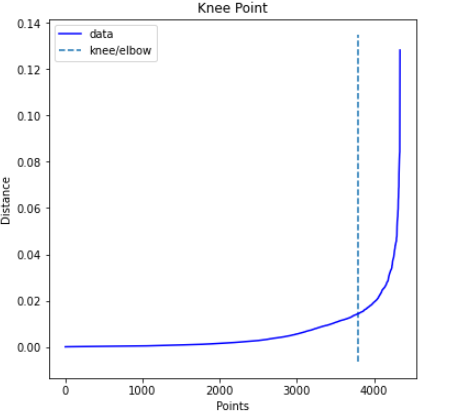
Most important parameter here is the EPS value which is calculated using knee distance. The knee/elbow curve is given in Figure 17.
Based on the knee distance, EPS value is calculated as 0.014473734767694877
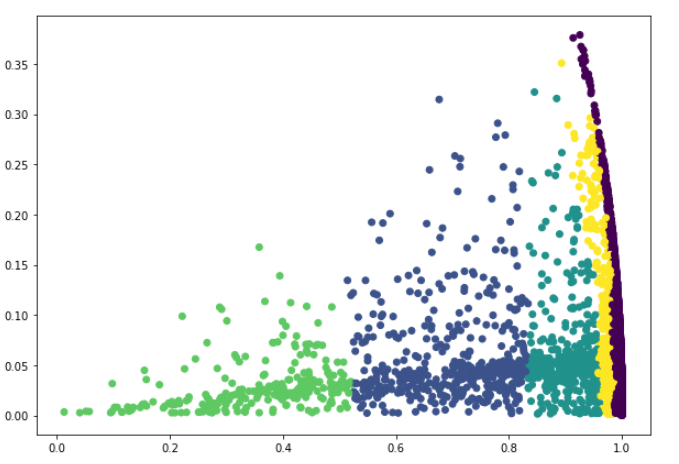
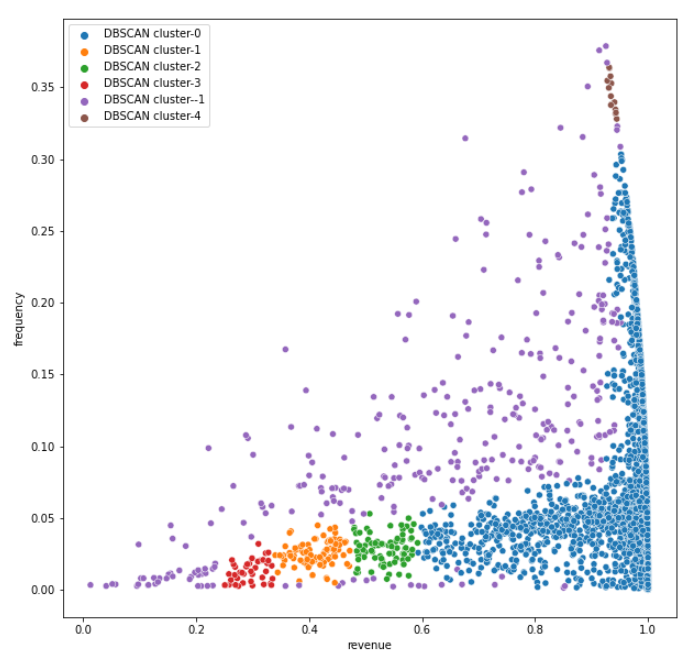
Although various other values are checked by running the same code several times, this EPS value yields a reasonable number of clusters (5) from a business view. The results of clustering are seen in Figure 18.
Here one thing to note is that cluster -1, in purple color, collects the data which is considered as noise. The other 5 clusters have more distinctive features in terms of annual spendings of customers. Although the portion of data is considered as noise, the remaining clusters are not easy to interpret from a marketing point of view for this clustering method.
Second Approach (non-AI Method) for Customer Cluster Analysis
Here the customers are segmented based on frequency of their purchase, recency of their last purchase, and total spending of last year per customer. The analysis has nothing to do with machine learning, but is performed to double check how machine learning based ClusterNo is in line with this second approach, which is based on business needs. This analysis is done especially because it is known that k-means is not a method to find an optimal solution. There is no loss function to minimize, and it only provides one solution which needs to be checked using a business perspective to decide whether it is meaningful clustering or not.
When considering the revenues, frequencies and recency as ‘low’, ‘mid’ and ‘high’, one can refer to quantile values for each. Quantile-based qcut function is used to divide the values into 5 categories for each column of the customer dataset. There is high variation among quantiles as seen in Table 2 below:
Business Perspective on Potential Customer Clusters (see Table 3):
So, from a business point of view 5 strategies are identified, and one can cluster customers based on these 5 marketing and sales action types. So, 5 main strategies are decided towards customers:
- Ignore: These are low value customers and no need to invest time/money on them
- Stimulate: Less active customers who might be turned into active customers with reminding promotions
- Welcome: Relatively new customers who are potential loyal customers, give attention to retain with welcome promotions.
- Reward: Loyal customers with base value, Silver Tier, reward them towards keeping loyalty
- Reward Exclusive: Loyal customers Gold and Platinum Tiers, reward and surprise them for being loyal.
For example, 3 levels of score combinations go under the IGNORE strategy as below (see Table 4):
Based on this grouping below clusters -named with marketing actions- are identified (see Table 5):
Conclusion
Comparison of AI and Non-AI Methods
Here is the histogram of clusters based on the mentioned strategies. The number of customers (data points) in each cluster are compared in AI solutions versus a non-AI business solution. So, the validity of the clustering is checked in this section, and they do not look similar in terms of number of customers per cluster.
Below is AI k-means clustering (see Figure 19):
When normalized data is used, better distributed clusters are obtained as shown below (see Figure 20):
So as suggested before, normalization of data brings some improvement in terms of balance of clusters. Below can be seen cluster distributions of Hierarchical Clustering (see Figure 21), Hierarchical Clustering with forced 5 clusters (see Figure 22), and DBSCAN Clustering (see Figure 23):
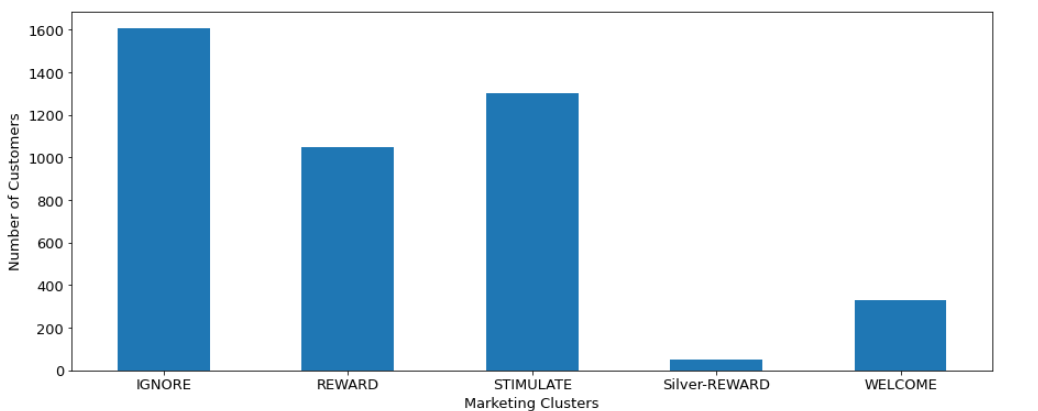
Below is Non-AI Clustering (see Figure 24):
As seen above, the business (marketing) perspective proposes more balanced clusters of customers and the majority strategy is ‘IGNORE’ for small and infrequent spenders. When other AI methods are reviewed in this manner, none of them is similar to this approach. So here is the time to remember again that none of the AI methods in clustering algorithms claim an optimal solution, they are difficult to validate and should be used if they offer anything intuitive.
Another analysis is to check out the clusters in terms of annual revenue i.e. spending amounts.
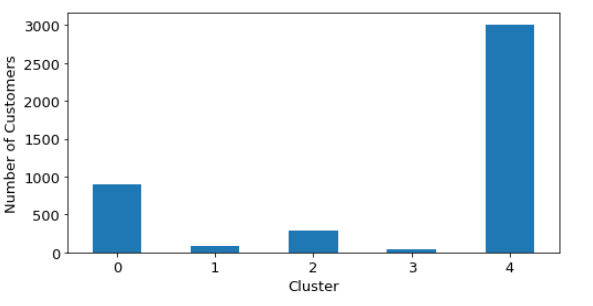
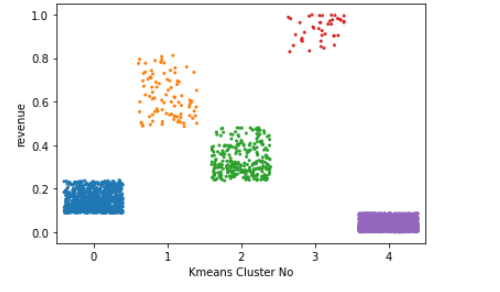
The data points, customers, in each cluster based on annual spending (revenues) are shown below as a result of k-means clustering (see Figure 25):
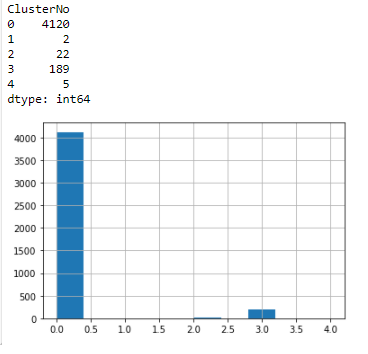
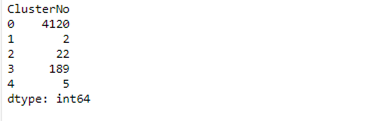
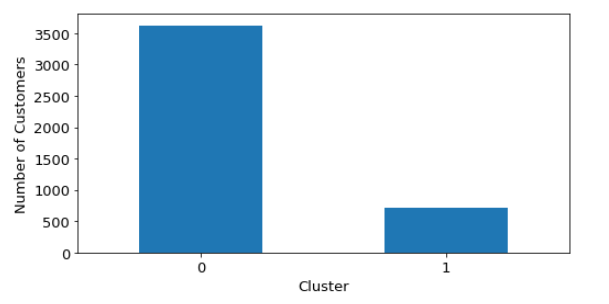
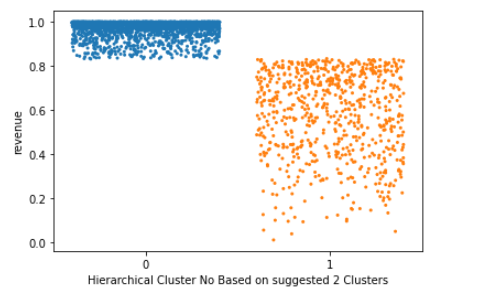
The customers in each cluster based on annual spending (revenues) are shown below as a result of Hierarchical clustering with 2 clusters (see Figure 26):
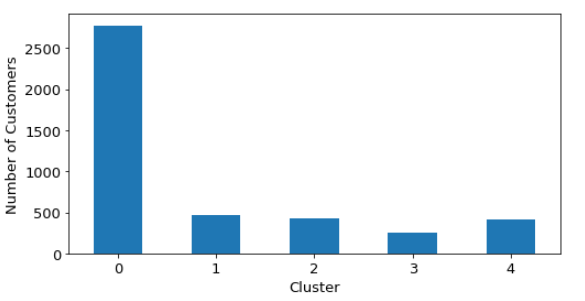
The customers in each cluster based on annual spending (revenues) are shown below as a result of Hierarchical clustering with 5 clusters (see Figure 27):
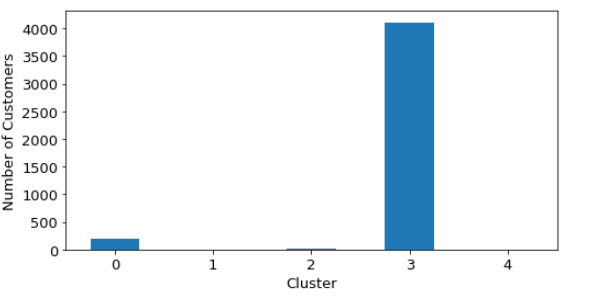
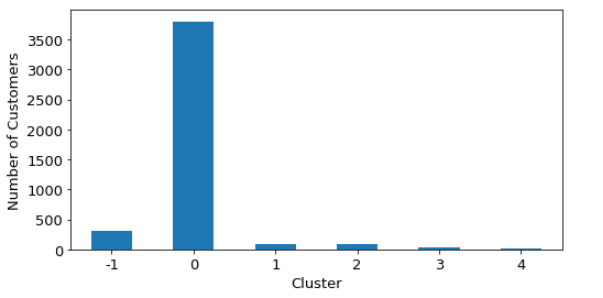
The customers in each cluster based on annual spending (revenues) are shown below as a result of DBSCAN clustering (see Figure 28):
The customers in each cluster based on annual spending (revenues) are shown below as a result of the non-AI marketing method (see Figure 29):
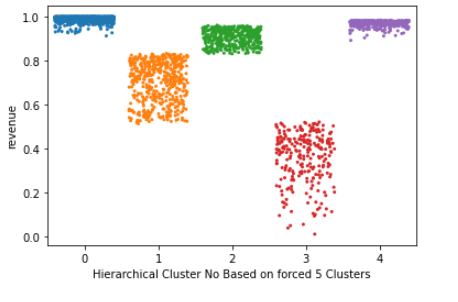
Here it looks surprising that the marketing logic based on recency, frequency and monetary does not perform well in terms of differentiating big spenders from small spenders. K-means and hierarchical clustering methods offer non overlapping and more intuitive solutions than the marketing perspective. When the hierarchical algorithm is forced to use 5 clusters, the clusters start to overlap as seen in Figure 27. Nevertheless, the hierarchical solution does not offer a good solution from a business point of view since it only suggests 2 clusters. DBSCAN performance is also questionable for two reasons. First, there are some overlaps between cluster no 0 and 4 as seen in Figure 28 and secondly, the noise cluster is too big and it covers all big and small spenders randomly. It might be not that great to exclude this many customers from the analysis for marketers.
As a result, although none of the algorithms offers a clear optimal solution, the best solution is coming from k-means clustering. The problem with this approach is that the resulting clusters are unbalanced in terms of number of customers in each cluster. So, whenever a segmentation problem is studied, the data itself plays a crucial role and a few methods have to be tested against the data to be able to come up with intuitive clusters. Now that various approaches are tested to be able to find reasonable clusters, many ideas emerged for the future as an extension to this work which could be found in the next section.
Future Work
Since there is no target in terms of how dense each cluster should be, it is difficult to decide where to stop searching for a better clustering method. For the time being, the analysis is stopped until different ideas can be developed. Two highest revenue value customer clusters have only 2 and 5 customers in it. It can give better results if we join those clusters into one, or even get a little bit bigger cluster as a further study of the k-means method.
Another extension could be running the k-means algorithm without random_state variable, letting to have different results in each iteration and comparing the results to find out the best option out of several iterations.
One future work could be about using re-scaled and transformed customer data for non-AI methods as well. Because even a marketing clustering has some overlaps in terms of spending of customers. There are some very high frequency revenue transactions in the data set and these might produce some distortion when it comes to clustering.
As a last application idea, the categorization approach could be changed to the non-AI (business) method. For example, revenue from 2-5 out of 5 is considered as a mid-high revenue category for a 1-5 scale. If mid-high is changed to 3-5 out of 5, we would get less number of customers in the ‘REWARD’ cluster which looks too big as of current solution.
At last, but not least, other clustering methods could be tried to see if better clusters could be obtained by an AI approach. All the clustering methods are analyzed in Chapter 2 Literature Review. Namely, grid based and model-based clustering algorithms could be tested against this dataset. For a grid-based approach, STING and CLIQUE could be used. And for model-based approach, statistical methods and neural network approaches could be utilized.
Acknowledgements
The author(s) declare that there is no conflict of interest.
References
Ahmad, A., & Khan, S. S. (2019). Survey of State-of-the-Art Mixed Data Clustering Algorithms. IEEE Access, 7, 31883-31902.
Bawack, R. E., Fosso Wamba, S., & Carillo, K. D. A. (2021). A framework for understanding artificial intelligence research: insights from practice. Journal of Enterprise Information Management, 34(2), 645-678.
Bogensperger, A., & Fabel, Y. A. (2021). practical approach to cluster validation in the energy sector. Energy Inform 4, 18.
Borges, A. F. S., Laurindo, F. J. B., Spinola, M. M., Goncalves, R. F., & Mattos, C. A. (2021). The strategic used of artificial intelligence in the digital era: Systematic literature review and future research directions. International Journal of Information Management, 57, 10225.
Chen, D., Sain, S. L., & Guo, K. (2012). Data mining for the online retail industry: A case study of RFM model-based customer segmentation using data mining. Journal of Database Marketing and Customer Strategy Management, 19(3), 197-208. https://archive.ics.uci.edu/ml/datasets/online+retail
Erlich, Z., Gelbard, R., & Spiegler, I. (2016). Evaluating a positive attribute clustering model for data mining. Journal of Computer Information Systems, 43(3), 100-108.
Ester, M., Kriegel, H. P., Sander, J., & Xu, X. (1996). A Density-Based Algorithm for Discovering Clusters in Large Spatial Databases with Noise. Proceedings of 2nd International Conference on Knowledge Discovery and Data Mining (KDD-96), 226-231.
Fotaki, G., Spruit, M., Brinkkemper, S., & Meijer, D. (2014). Exploring Big Data Opportunities for Online Customer Segmentation. Int. J. Bus. Intell. Res. 5(3), 58–75.
Gelbard, R., Goldman, O., & Spiegler, I. (2007). Investigating diversity of clustering methods: An empirical comparison, Data & Knowledge Engineering, 63(1), 155-166.
Hackenberger, B. K. (2019). Data by data, Big Data. Croatian medical journal, 60(3), 290–292.
Jung, A. (in press). Machine Learning: The Basics. Available online at https://alexjungaalto.github.io/MLBasicsBook.pdf
Kaur, R., & Kaur, K. (2017). Data Mining on Customer Segmentation: A Review. International Journal of Advanced Research in Computer Science, 8(5).
Kovács, T., Ko, A., & Asemi, A. (2021). Exploration of the investment patterns of potential retail banking customers using two-stage cluster analysis. J Big Data 8, 141.
Madhulatha, T. S. (2012). An overview on clustering methods. IOSR Journal of Engineering, 2(4), 719-725.
Mustapha, F. Z., Haruna, A. A., & Muhammad, U. T. (2020). An Overview of Artificial Intelligence. Journal of Applied Sciences & Environmental Sustainability, 6(12), 60-74.
Qian, C., Yang, M., Li, P., & Li, S. (2018). Application of Customer Segmentation for Electronic Toll Collection: A Case Study. Journal of Advanced Transportation, Article ID 3635107.
Siebert, M., Kohler, C., Scerri, A., & Tsatsaronis, G. (2018). Technical Background and Methodology for Elsevier's Artificial Intelligence Report. 1-7. https://www.elsevier.com/?a=829143
Sun, Z.-H., Zuo, T.-Y., Liang, D., Ming, X., Chen, Z., & Qiu, S. (2021). GPHC: A heuristic clustering method to customer segmentation. Applied Soft Computing, 111, 107677.
The Association for Computing Machinery’s Special Interest group on Knowledge Discovery and Data Mining (SIGKDD). (2021). SIGKDD Test of Time Award Winners. https://www.kdd.org/awards/view/2014-sikdd-test-of-time-award-winn
Tobin, S., Jayabalasingham, B., Huggett, S., & de Kleijn, M. (2019). A Brief Historical Overview of Artificial Intelligence Research. Information Services & Use, 39(4), 291-296.
Vlacic, B., Corbo, L, e Silva, S. C., & Dabic, M. (2021). The evolving role of artificial intelligence in marketing, A review and research agenda. Journal of Business Research, 128, 187-203.
Copyright information

This work is licensed under a Creative Commons Attribution-NonCommercial-NoDerivatives 4.0 International License.