Use Progressive Visualization Teaching Method to Improve Learning Motivation of Calculus Courses

Abstract
The current Generation-Z students have the characteristics of active learners and visual gamers. The traditional teaching method only guides students to learn theoretical knowledge, lacking the experience of learning by doing and the challenge of solving practical problems. Therefore, this study proposes a three-stage progressive teaching method that uses traditional lectures, mathematical software, and visual problem-solving models incrementally over a semester. The purpose of this study is to provide students with an experiential learning environment to explore changes in their understanding and interest in calculus by sequentially engaging in three different teaching methods. The results of this research show that the introduction of visual mathematical software can allow students to directly observe the curve trend of functions, which is in line with the observer behavior of Generation Z’s learning preferences. Furthermore, engaging in creative projects enables students to apply concepts from the theory of variation to identify relationships between mathematical components and then create visual models for solving problems. Students agreed that the proposed three-stage pedagogy enhanced their interest in learning which allowed them to gain an applied knowledge of calculus through experimental learning.
Keywords: Progressive pedagogy, interactive mathematical software, visual problem-solving models, calculus teaching, three teaching stages
Introduction
Instructors teaching university calculus courses often find that students have difficulty understanding mathematical theories, even if they recognize that calculus courses are important mathematics courses in university programs. That is because traditional teaching methods are teacher-centered and student-teacher interaction is limited, resulting in low student engagement in the course and low learning motivation. To address the problem of students’ low cogitative capabilities and lack of theoretical understanding, Laurillard (2013) proposed information processing theory, where problem identification and problem-solving skills are reflected in the process of receiving, storing, and locating new information.
The current generation of university students born between 1995 and 2010 is referred to as Generation Z (Gen-Z). In terms of learning characteristics, Gen-Z students have two specific characteristics. First, they are observers, that is, they prefer to watch others complete tasks and then apply what they have learned on their own. Secondly, they care deeply about the importance of being able to apply what they learned in a variety of everyday situations (Seemiller & Grace, 2017). They are adept at using various digital technologies to access information quickly; as a result, their learning characteristics tend toward real-time query, visual learning, and learning by doing (Engelbrecht et al., 2020). As a result. Gen-Z students may be easily distracted during traditional teacher-centered lectures. Therefore, the teaching of mathematics should use a visualization approach, such as interactive software, to solve mathematical problems; and achieve learning outcomes through experiential learning, thereby increasing students’ interest in learning and finally strengthening their learning outcomes (Arts et al., 2006).
Rolka et al. (2006) showed that visualization techniques are a powerful tool for exploring problems and giving meaning to concepts. That is because visualizing mathematical theories reduces the burden of processing large amounts of information. Therefore, people can intuitively express the problems in daily life in mathematical form and deal with them easily (Kulcsár, 2018). The use of visual mathematics models for teaching can help students understand, remember, and apply mathematical theory through visual images (Hadjerrouit & Gautestad, 2019). Teaching mathematical theory through visual models is therefore an effective learning method derived from the basic definition of mathematics. By creating visual models, students can represent the meaning of mathematical formulas to deepen their understanding of the relationships between theories (Pereira et al., 2017).
In addition, Leung (2003) proposed the theory of variation from the concept of phenomenography as a method to explore problems and understand concepts. Teaching practices based on the variation theory strongly focus on the process of learning and the condition of learners. Therefore, the theory of variation is manifested in the interaction between the environment in which the learner is embedded and the knowledge that he or she wants to learn. Dockendorff and Solar (2018) applied the theory of variation to teach math and use a digital tool as a facilitator of visualization. Based on the theory of variation, the teaching approaches uncovered through this study gradually guide students to identify the specific conditions of each problem, realize the interaction between features, integrate the key dimensions of variation, and establish invariant patterns of the problem throughout the learning process.
According to the characteristics of Gen-Z students, this study proposes a step-by-step three-stage teaching method that gradually uses traditional lectures, mathematical software, and visual problem-solving models to teach calculus within a semester.
Background
According to the findings from Northeastern University’s Innovation Survey (Donaghy, 2014), the learning preferences of Gen-Z students have three specific dimensions. First, Gen-Z students prefer to engage in a learning environment and immediately apply what they learn to real life. Second, Gen-Z students prefer to learn through video content. Before learning any skill, they try to find information through online videos and watch someone apply the skill correctly. Third, the motivation to learn comes from the extent to which knowledge can be applied. That is, they want to know that what is learned is not just a textbook example, but has wider applicability in life (Seemiller & Grace, 2017). Therefore, this study applies the principles of information processing theory, visualization technology, and variation theory respectively to meet the three learning preferences of Gen-Z students, thereby proposing a progressive learning environment.
Firstly, this study follows the information processing theory to create a step-by-step mathematics teaching environment for Gen-Z students. The basic philosophy of information processing theory is gradually reflected in students’ abilities in knowledge memory, comprehension, interpretation, and application in the whole teaching progress. According to Parrot and Leong (2018), information processing theory is the process of receiving, storing, and defining information in the problem-solving process. It follows that the development of an experiential learning environment requires a focus on the integration of information processing and solution approaches, such as the absorption of general knowledge and the adoption of comprehension strategies (Parrot & Leong, 2018).
Secondly, this study introduces mathematical software as a visualization technology of calculus learning which suits the observer characteristic of Gen-Z students. Presmeg (2020) suggested that visualization is a process that includes the construction and transformation of visual mental images. According to Hadjerrouit and Gautestad (2019), visualization uses images, diagrams, and digital tools to enhance understanding. Dockendorff and Solar (2018) represent mathematical concepts, principles, and problems as visualization material to explore mathematical problems and understand phenomena. Atnafu and Zergaw (2020) proposed that visualization is the drawing of images based on the mathematical structures that people create in their minds. Therefore, the visualization process is conducive to problem-solving, where the use of visual representations and images as part of the solution strategy often helps to achieve results.
Thirdly, this study then applies the variation theory to encourage students to engage in a creative project in which students are expected to construct mathematical models by using concepts from real-life scenarios. The theory of variation is based on phenomenography to reflect the process of knowledge acquisition. According to Leung (2003), the representational style of variation theory becomes the most powerful learning tool for generating systematic interaction between learners and teaching materials. Visual representations using the theory of variation enable students to experience mathematical concepts and identify the main features of problems, thereby understanding mathematics by focusing on problem-solving approaches rather than on formula deduction skills (Attorps et al., 2016).
Finally, through the innovative teaching approaches uncovered through this study, the Gen-Z students were guided to create their visual mathematical models, in which students practice how to visualize the relationships between related concepts and interactively present the solution process in order to reduce the amount of information that should be remembered. According to Presmeg (2020), visualization ability is an important skill to solve mathematical problems, and this visual reasoning ability is becoming increasingly important in the information age. In particular, understanding the various situations related to the problem and objects influenced by the problem at the cognitive level helps students to develop appropriate solutions to the problem (Nurhajarurahmah, 2021; Phillips et al., 2010).
Purpose of the Study
The purpose of this study is to increase knowledge comprehension by introducing visual mathematical software and to enhance learning interest by engaging in creative projects, so as to gradually improve learning outcomes. Unlike most literature that only studies the effectiveness of a single teaching method, the design principle of this study is to explore the changes in students' interest in learning calculus after experiencing three different teaching methods in sequence. Through such three-stage experiential learning, each student can clearly distinguish the differences in learning skills and feedback their learning experience to the teacher.
Methodological Approach
The course of this study is a basic calculus course at the College of Business, Chung Yuan Christian University, Taiwan. This study explored mathematics teaching strategies according to the characteristics of Gen-Z students and therefore used information technology with visual teaching materials to share learning experiences with students (Joubert et al., 2020).
Research Design
The research design was developed by the researcher to identify an innovative teaching method, as shown in Figure 1, through strategic planning, teaching practice, and analysis of the outcomes of the study. Therefore, a three-stage innovative teaching method was developed: (1) implementing traditional textbook instruction, (2) using mathematical software, and (3) introducing visual models. The ultimate aim of this study is to explore student learning outcomes, focusing on enhancing students’ learning enjoyment and level of comprehension. The research steps in the research design are described as follows:
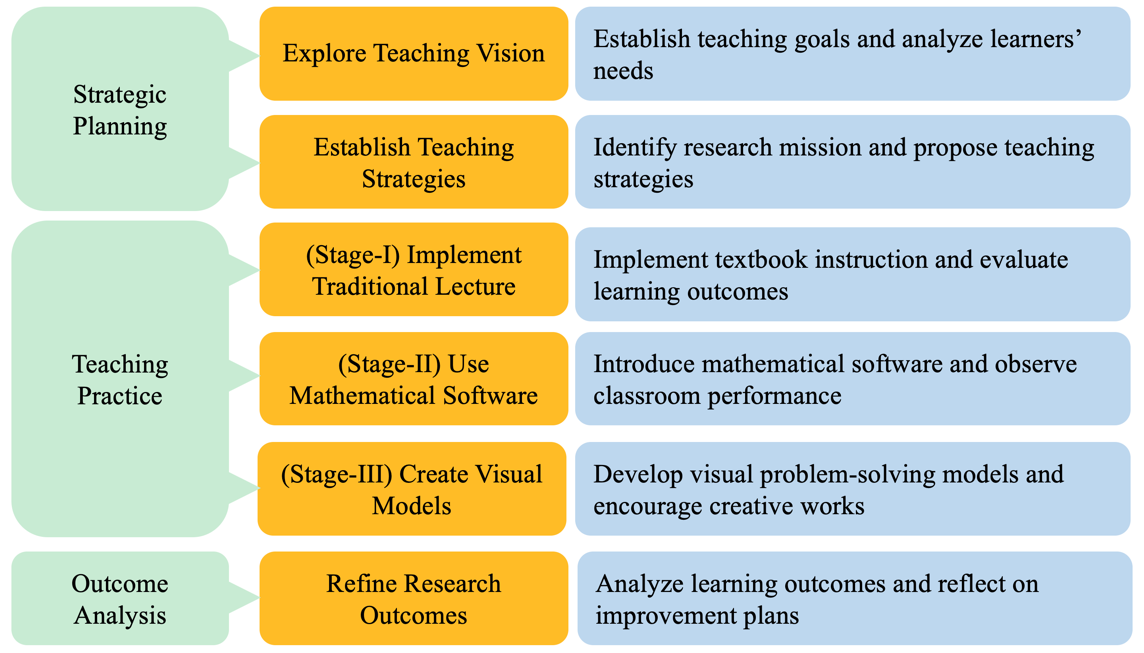
Step 1. Explore teaching vision
Step 1-1. Establish teaching goals: this study aims to enhance students’ understanding, increase learning interest, and improve learning outcomes.
Step 1-2. Analyze learners’ needs: understanding the learning preferences of Gen-Z students and using software and visual teaching materials to stimulate students’ learning interests.
Step 2. Establish teaching strategies
Step 2-1. Identify the research mission: study the impact of using the proposed teaching methods, including the use of mathematical software and visual models in calculus courses.
Step 2-2. Propose teaching strategies: according to the knowledge level of course content, the teaching process is divided into three stages, allowing students to gradually experience the changes between different learning methods.
Step 3. Implement traditional lecture
Step 3-1. Implement textbook instruction: the basic concepts of calculus were taught in a traditional textbook.
Step 3-2. Evaluate learning outcomes: students’ feedback showed that they only memorized mathematical formulas and lacked understanding of fundamental concepts.
Step 4. Use mathematical software
Step 4-1. Introduce mathematical software: mathematical software can visualize function graphs and provide students with step-by-step problem-solving guidance, which is in line with the real-time learning characteristics of Gen-Z students.
Step 4-2. Observe classroom performance: the teacher gave applied problems in the classroom for students and reviewed students’ level of comprehension in real-time through the students’ learning notes.
Step 5. Create visual models
Step 5-1. Develop visual problem-solving models: use visual mathematical models to help explain mathematical concepts to stimulate students’ learning preferences.
Step 5-2. Encourage creative works: guide students to cooperate in the development of visual mathematical models to increase students’ interest in learning.
Step 6. Refine research outcomes
Step 6-1. Analyze learning outcomes: students’ feedback and questionnaire surveys were collected three times during the research to measure students’ learning interests and level of comprehension. Students were able to improve their learning comprehension and enjoyment gradually, thereby enhancing their learning outcomes.
Step 6-2. Reflect on improvement plans: it is necessary to continuously improve teaching methods is adjust the evaluation rubrics to suit the characteristics of students.
Study Participants
A class of students from the Department of Information Management, College of Business, Chung Yuan Christian University participated in this teaching research. There are thirty-five students in the class. They were born between 2001 and 2002, i.e., belong to Gen-Z students. The number of male and female students is roughly equal. All students are taught by the same teacher. All participants were similar in that they did not differ significantly in their academic background and learning experience.
The Proposed Progressive Teaching Method
This study proposes a progressive visualization teaching method, which gradually uses traditional lectures, visual mathematical software, and visual problem-solving models to teach calculus. This proposed three-stage teaching method guides students through the stages to progress step by step. Table 1 lists the key learning objectives, learning activities, and teaching methods for each stage.
In the three teaching stages, students used different learning approaches for different levels of knowledge. As the depth of knowledge acquired gradually increased, the difficulty of the corresponding activities also increased. The main purpose of this progressive teaching method is to increase the learning comprehension and motivation of Gen-Z students, ultimately improving learning outcomes.
- Teaching Stage I uses traditional textbooks for teaching: because university freshmen who just graduated from high school are still accustomed to traditional textbook instruction, the “differential calculus” units were taught through traditional lectures to establish a foundation of knowledge. Students can use calculation rules and calculation skills to solve basic problems.
- Teaching Stage II uses mathematical software to assist teaching: for the “Applications of the Derivative and Optimization Topics” units, mathematical software helped students to understand the geometry of functions in applied problems. With the support of mathematical software, students learn to identify causal relationships of mathematical functions, understand the logic behind them, and then solve optimization problems.
- Teaching Stage III introduces visual mathematical models: the instructor demonstrated visual modeling skills for solving the “Integration by Parts” and “Integration by Substitution” problems. Students worked in teams to create their own visual models as support tools for solving calculus problems.
Research Method
This research used a combination of quantitative and qualitative research methods. During the teaching process, this study collected quantitative data through three questionnaires to understand students’ feedback after going through each teaching stage, and two exams to analyze students’ academic performance after Teaching Stage I and III.
Four types of qualitative data were also collected in this study. The methods and purposes of data collection are described below.
- Informal interviews were conducted with selected volunteer students at the beginning of the course to understand student expectations for the calculus course.
- All students’ feedback after Teaching Stage II revealed their psychological feelings about using visual math software to learn calculus; The method of data collection is through the feedback mechanism of the online learning platform. Taking a voluntary approach, students share their learning experiences spontaneously.
- Online learning feedback from all students was collected after Teaching Stage III to reflect individuals’ learning experience in participating in the teamwork project. The data gathering method for this information is also voluntary. The researcher only described the direction of this learning feedback, allowing students to freely share their creative experiences.
- The teaching effectiveness evaluation at the end of the semester was completed by the students to record their learning experiences after participating in the three teaching stages. This information is an open-ended question for the assessment of teaching effectiveness, which is implemented by schools to collect teaching suggestions from students.
Research Procedure
Teaching Stage I: Traditional Textbook Instruction
At the beginning of the calculus course, the researcher conducted an informal interview to understand students’ expectations for the calculus course. Most students have the impression that calculus is difficult to understand and belongs to mathematical theoretical knowledge, so their learning interest and learning motivation are very low. This was the primary reason which drove this study, which is to improve students' interest in learning.
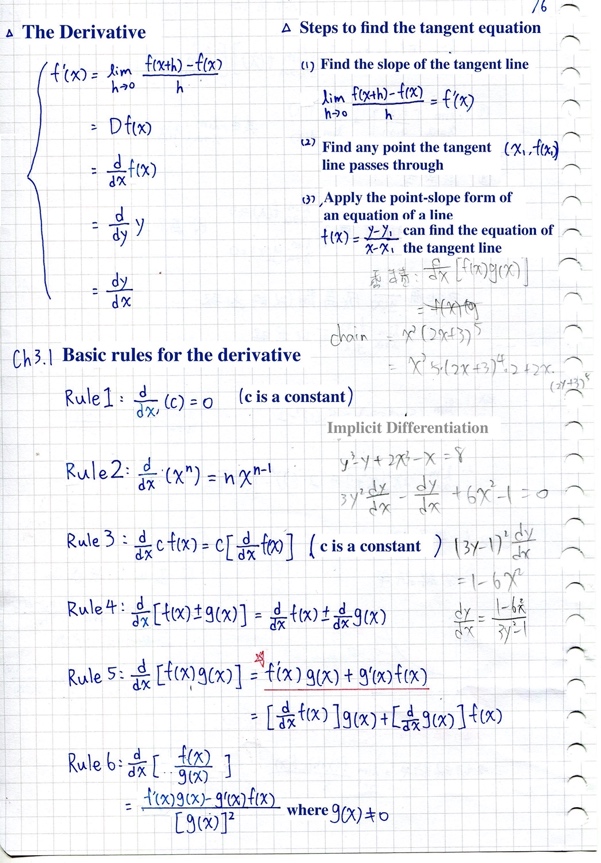
Table 2 clearly shows that in Teaching Stage I, the teacher taught using traditional textbook lectures in class. Most of the students’ class notes only consisted of copying and memorizing the basic theories of calculus differentiation taught in class, as shown in Figure 2. In addition, students’ learning notes showed that students only memorized calculus formulas and did not increase comprehension or learning interest. Therefore, the research motivation for this study to propose innovative teaching techniques was reinforced.
Teaching Stage II: Introducing Interactive Mathematical Software
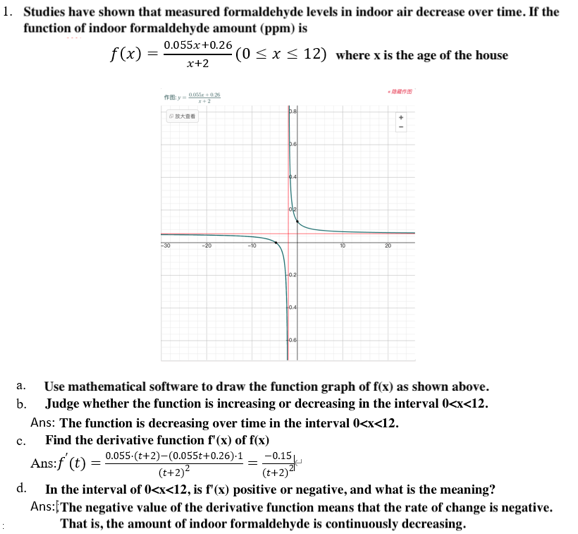
Table 3 shows that Teaching Stage II used mathematical software to explain the “Applications of the derivative and optimization topics” units. The teacher guided students to input the mathematical formulas into visual mathematical software and analyze the graph of optimization problems. Students were able to understand the maximum and minimum values of a function. For example, Figure 3 shows an example of students’ works in Teaching Stage II. This assignment was to analyze the variation in indoor formaldehyde levels and interpret the trend of concentrations over time. Students were asked to plot the function graph of the formaldehyde levels in indoor air to determine the trends of increasing/decreasing over time intervals. Through geometric analysis, students can use mathematical software to deepen their understanding of calculus problems and enhance their learning understanding.
Teaching Stage III: Developing Visual Problem-Solving Models
The implementation of Teaching Stage III shows in Table 4. The teacher introduced visual problem-solving models in the classroom to assist in teaching the “Integration by Parts” and “Integration by Substitution” units. After that, students were guided to solve calculus problems by using those visual mathematical models. The purpose of students working in groups to create graphical models was to allow them to (1) visualize mathematical concepts to enhance their understanding of the subject and (2) work together through group collaboration to enhance learning enjoyment.
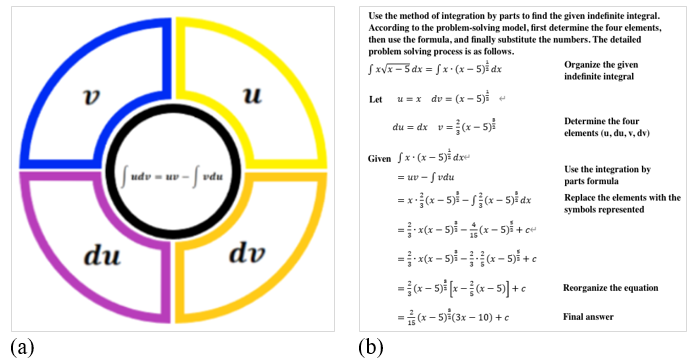
Taking the works of two groups of students as an example, as shown in Figure 4, students used “Integration by Parts” as the topic of the assignment and proposed a visual problem-solving model to explain the rules of integration. Students’ learning outcomes and design concepts can be shown through these two examples:
Project 1: Students transformed the problem-solving steps of the “Integration by Parts” unit into a visual model as shown in Figure 4(a), in which the relationship between the four units (, d,, d) was drawn as four colors in a color wheel. This student work showed that students were able to integrate the sequence of problem-solving into a meaningful graphical model. After that, students used their visual mathematical models to solve actual problems and demonstrated their solution process in Figure 4(b).
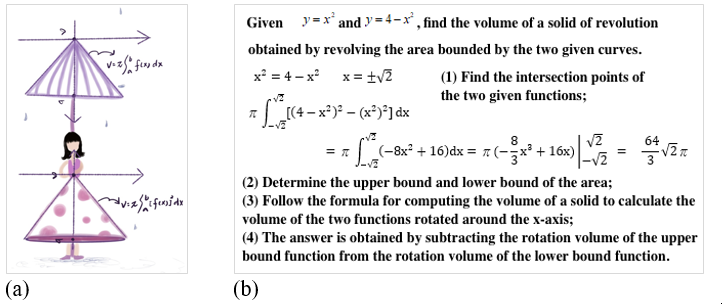
Project 2: For the “Volumes of Solids of Revolution” unit, an example of the visual mathematical models developed by students is shown in Figure 5(a). In the visual model, students designed an umbrella to represent a two-dimensional flat triangular area, and also a girl’s skirt to represent the corresponding three-dimensional cone volume. Students also narratively described the concept, fully demonstrating that they understood the core concept of rotational volume: by rotating the area of a function-enclosed area around a line. Students remembered the meaning of concepts to solve a calculus problem as the description in Figure 5(b).
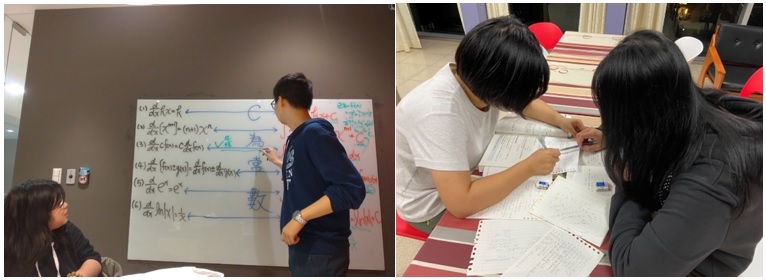
From the photos of the students working in teams on the project with classmates shown in Figure 6, together with the feedback from student groups, we found that students’ calculus learning enjoyment was significantly improved by group interaction during the project.
Results
Questionnaire Survey
This study implemented a three-stage teaching method step-by-step within a semester. At the end of each teaching stage, a questionnaire was conducted to collect student feedback. The purpose of these three questionnaire surveys is to compare the differences in students’ learning experiences at different teaching stages, especially in terms of learning comprehension, learning interest, and learning motivation. Table 5 shows the items of the three questionnaires. The researcher used a five-point Likert-type response format (1 for least impact and 5 for greatest impact), where each student could choose to agree or disagree. Questionnaire A conducted after Teaching Stage I was designed to measure the effectiveness of textbook teaching. Questionnaire B focused on Teaching Stage II and assessed the impact of the use of mathematical software on the learning of calculus. Questionnaire C, conducted after Teaching Stage III, collected the learning experiences of the visual problem-solving models.
Analysis of the three questionnaire results in Table 6 can lead to the following findings:
- In terms of impact on students' learning understanding, the mode of the first teaching stage was 3 (42%), the second teaching stage was 3 (42%), and the third teaching stage was 3 (44%). From the number of students with the highest impact of 5 points, the first and second stages of teaching are both 12% of students, and the third stage of teaching has increased to 22% of students. The above findings demonstrate that students' learning comprehension is significantly improved through the implementation of the visual modeling projects.
- In terms of the impact on students' learning enjoyment, the average value decreased from 3.23 in the first teaching stage to 2.81 in the second stage, and then increased to 3.32 in the third teaching stage. From the perspective of the proportion of students with a point of 5 in the questionnaire, from 7% of students in Teaching Stage I to 5% of students in Teaching Stage II, and then to 19% of students in Teaching Stage III. It can be observed that although the effect of Teaching Stage II on the students' interest in learning is not high, after entering the third stage of teaching, students' learning interest increases with the use of calculus visual teaching materials.
- In terms of the impact on students' learning motivation, the mean value of Teaching Stage I was 3.21, Teaching Stage II was 2.69, and Teaching Stage III was 3.39. From the perspective of the proportion of students who believe that it has the highest degree of influence on learning motivation, 5% of the students agreed with the first teaching stage, 3% of the students agreed with the second teaching stage, and 18% of the students agreed with the third teaching stage. Based on the above findings, the distribution trend of the influence of this study on students' learning motivation is consistent with the distribution trend of learning interest.
Observing the above three results shows that the number of students who agreed that the pedagogy had the greatest impact was increasing during the implementation of this three-stage teaching method. It also shows that the visual teaching method in Teaching Stage III is more effective than the traditional method in Teaching Stage I. However, using math software to visualize calculus functions in Teaching Stage II did not bring the expected results. It may be that students are not familiar enough with the operation of mathematical software to feel its advantages. Although the questionnaire results in the second teaching stage were poor, the students' learning comprehension, learning interest, and learning motivation was improved after fully experiencing the three teaching stages of this study.
Student Feedback and Perspectives
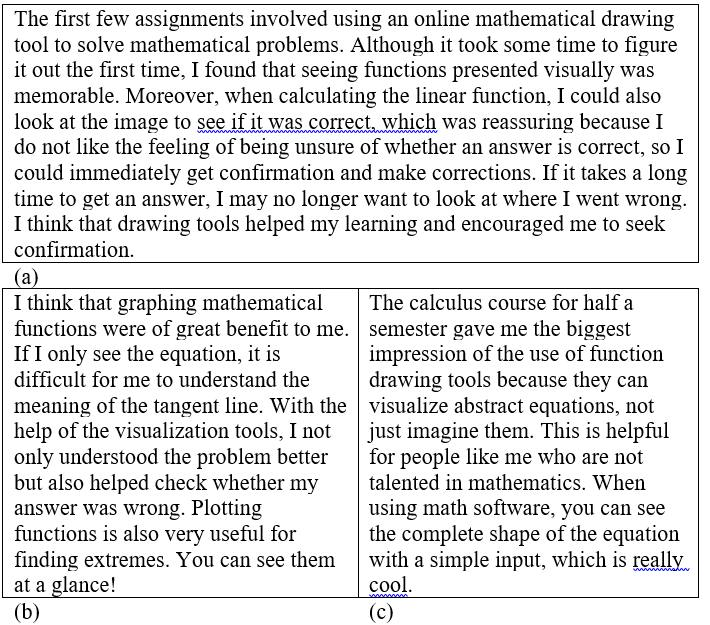
This study uses the feedback mechanism of an online learning platform to collect students' learning experiences as qualitative data. Thanks to the voluntary method of collecting students’ learning experiences, the teacher collected about 80% of students' learning experiences after the second and third stages of teaching. Figure 7 shows three examples of students’ feedback after they experienced the use of mathematical software to visualize geometric curves of mathematical functions in Teaching Stage II. Most students believe that the use of mathematical software enables them to visualize the characteristics of mathematical functions, increase their understanding of calculus problems, and help them learn calculus knowledge. That is, the use of visual math software provides students with the opportunity to observe the solution processes, in line with the observer characteristics of Gen-Z students.
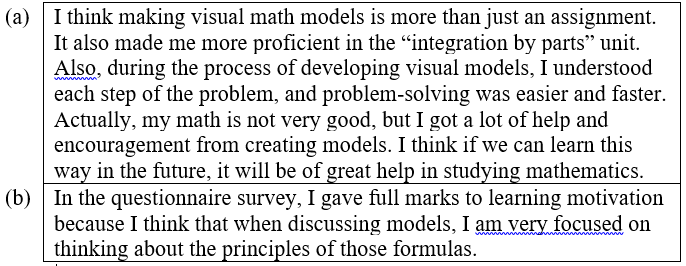
In Teaching Stage III, the teacher introduced visual mathematical models for calculus teaching. Students worked in teams with classmates after class to create their own visual models to solve calculus problems. Two examples of students’ online feedback are shown in Figure 8. The students created visual mathematical models to help them understand the meaning of the solution process, which aided them in solving calculus problems. Most of the students in the class agreed that the use of visual mathematical models in calculus learning can effectively enhance learning motivation.
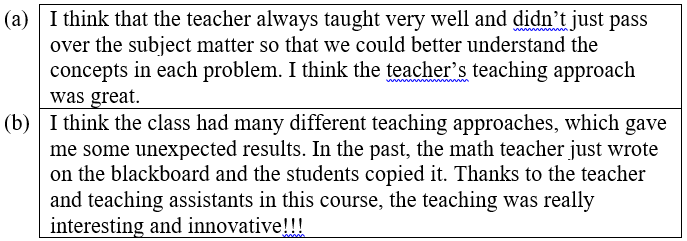
After the three teaching stages are fully implemented, students reported their learning feedback on the teaching effectiveness evaluation. Most students expressed high support and affirmation for the progressive three-stage teaching method adopted in this study. Figure 9 shows two student feedbacks as examples. As shown in Figure 9(a), the student indicated that the implementation of this innovative teaching method improved learning comprehension. In Figure 9(b), the student found the innovative teaching method of using mathematical software to draw functions and visual mathematical models unexpectedly effective. The student found that, unlike traditional lectures, this innovative teaching method was interesting, and the student appreciated the learning experience. Most of the students who participated in this study were highly supportive that the progressive teaching method can improve their motivation to learn calculus.
Results of Academic Performance
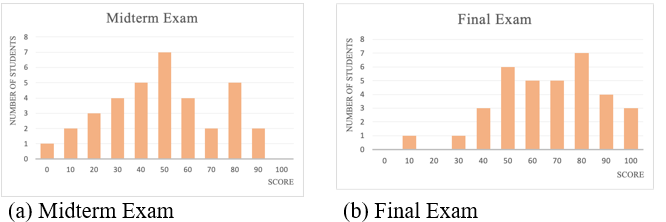
To analyze students’ learning performance, the statistics of students’ scores in mid-term and final exams are shown in Table 7. Mid-term exams are held after Teaching Stage I and final exams are held after Teaching Stage III. The average score on the students' exams increased from 47.1 on the midterm exam to 66.2 on the final exam. Showing that the use of visual pedagogy can help improve overall academic performance.
The distribution of students’ midterm and final exam scores are shown in Figures 10(a) and 10(b), respectively. In terms of the overall grade distribution, students performed better on the final exam than on the midterm exam. It can be inferred that through the visual teaching method proposed in this study, students' academic performance can be effectively improved.
Conclusion
The learning characteristics of Generation-Z students are different from other generations. They are pragmatists who like to experience the complete process of knowledge learning. They assess the truth of theories in terms of the success of their practical application. Therefore, this study proposes a step-by-step three-stage pedagogy to teach calculus courses, in which the basic concepts of calculus are first taught in traditional textbook lectures, and then students are guided to solve calculus problems with mathematical software, and finally, creative projects are carried out to encourage students to develop their visual mathematical models. The purpose of this study is to allow each student to experience the differences in the learning motivation of different teaching methods, especially in learning comprehension and learning interest.
According to the “observer” characteristics of Generation-Z students, traditional textbook instruction is not suitable for current students to learn calculus effectively and actively. Therefore, this study introduces visual mathematical software to solve the difficulties faced by students in calculus learning. The results of the study show that students can improve their understanding of calculus theory through the practice of mathematical software. However, the complexity of learning math software to solve problems may reduce students' interest in learning and thus reduce their motivation to learn math software.
Furthermore, the “learning-by-doing” characteristics of Generation-Z students inspired this research to initiate a creative project for students to build visual mathematical models and apply calculus knowledge to solve problems. Students’ feedback also shows that the creative project improves their problem-solving skills and produces new insights into mathematics learning, thereby increasing their interest in learning.
Finally, the results of this study demonstrate that the proposed progressive three-stage pedagogy is suitable for Generation-Z students to learn calculus. Students can clearly distinguish the differences in their learning experiences and feedback that the use of different kinds of visual materials in the three teaching stages not only improves learning comprehension but also increases their motivation to learn calculus.
Acknowledgements
There is no conflict of interest. This work is supported in part by the Ministry of Education, Taiwan, R.O.C. under the grant number PMS1100258.
References
Arts, J. A., Gijselaers, W. H., & Segers, M. S. (2006). Enhancing problem-solving expertise by means of an authentic, collaborative, computer supported and problem-based course. European Journal of Psychology of Education, 21(1), 71–90.
Atnafu, M., & Zergaw, D. (2020). Availability of resources, mathematics teachers’ knowledge, and attitude towards mathematics visualization as predictors of the development of students’ visualization in mathematics. Bulgarian Journal of Science and Education Policy, 14(2), 382–416.
Attorps, I., Björk, K., & Radic, M. (2016). Generating the patterns of variation with GeoGebra: the case of polynomial approximations. International Journal of Mathematical Education in Science and Technology, 47(1), 45–57.
Dockendorff, M., & Solar, H. (2018). ICT integration in mathematics initial teacher training and its impact on visualization: the case of GeoGebra. International Journal of Mathematical Education in Science and Technology, 49(1), 66–84.
Donaghy, R. (2014, November 18). Innovation imperative: meet Generation Z. Northeastern University Innovation Survey. https://www.northeastern.edu/news/2014/11/innovation-imperative-meet-generation-z/
Engelbrecht, J., Llinares, S., & Borba, M. C. (2020). Transformation of the mathematics classroom with the internet. Zdm, 52, 825–841.
Hadjerrouit, S., & Gautestad, H. H. (2019). Evaluating the usefulness of the visualization tool SimReal+ for learning mathematics: A case study at the undergraduate level. In D. Sampson, J. Spector, D. Ifenthaler, P. Isaías, S. Sergis, (eds) Learning Technologies for Transforming Large-Scale Teaching, Learning, and Assessment. Springer, Cham.
Joubert, J., Callaghan, R., & Engelbrecht, J. (2020). Lesson study in a blended approach to support isolated teachers in teaching with technology. ZDM, 52(5), 907–925.
Kulcsár, N. (2018, November 2–4). Teaching mathematics through images: the importance of visuality in university coursebooks. In International Conference on Research in Education, Teaching and Learning (pp. 59–67), Paris, France.
Laurillard, D. (2013). Rethinking university teaching: a conversational framework for the effective use of learning technologies. Routledge.
Leung, A. (2003, July 13–18). Dynamic geometry and the theory of variation. In International Group for the Psychology of Mathematics Education (v.3, pp. 197–204). Honolulu, HI.
Nurhajarurahmah, S. Z. (2021). Students’ multiple intelligences in visualization of mathematics problem solving. Journal of Physics: Conference Series, 1752(1), 1–7.
Parrot, M. A. S., & Leong, K. E. (2018). Impact of using graphing calculator in problem solving. International Electronic Journal of Mathematics Education, 13(3), 139–148.
Pereira, L. R., Jardim, D. F., & da Silva, J. M. (2017). Modelling plane geometry: the connection between geometrical visualization and algebraic demonstration. Journal of Physics: Conference Series, 936(1), 1–6.
Phillips, L. M., Norris, S. P., & Macnab, J. S. (2010). Visualization in mathematics, reading and science education. Springer Science & Business Media.
Presmeg, N. (2020). Visualization and learning in mathematics education. Encyclopedia of Mathematics Education, 900–904.
Rolka, K., Rösken, B., & Liljedahl, P. (2006). Challenging the mathematical beliefs of preservice elementary school teachers. In J. Novotná, H. Moraová, M. Krátká & N. Stehlíková (Eds.), In International Group for the Psychology of Mathematics Education (v. 4, pp. 441–448). Prague, Czech Republic: PME.
Seemiller, C., & Grace, M. (2017). Generation Z: Educating and engaging the next generation of students. About Campus: Enriching the Student Learning Experience, 22(3), 21–26.
Copyright information

This work is licensed under a Creative Commons Attribution-NonCommercial-NoDerivatives 4.0 International License.